


People


Employment practice
Employee headcount and type | 2021 | 2020 | 20191 | 2018 | 2017 |
|---|---|---|---|---|---|
Group total | |||||
Total employee headcount (number) | 8,116 | 8,060 | 7,960 | 7,843 | 7,751 |
Full-time (number) | 7,930 | 7,865 | 7,754 | 7,634 | 7,542 |
Part-time (number) | 186 | 195 | 206 | 209 | 209 |
Permanent (average %) | 87.0 | 87.6 | 87.8 | 87.2 | 86.7 |
Fixed-term contract (average %) | 13.0 | 12.4 | 12.2 | 12.8 | 13.3 |
Hong Kong | |||||
Total employee headcount (number) | 4,771 | 4,689 | 4,604 | 4,543 | 4,515 |
Full-time (number) | 4,770 | 4,688 | 4,603 | 4,538 | 4,504 |
Part-time (number) | 1 | 1 | 1 | 5 | 11 |
Permanent (average %) | 83.5 | 85.1 | 85.4 | 84.0 | 83.1 |
Fixed-term contract (average %) | 16.5 | 14.9 | 14.6 | 16.0 | 16.9 |
Mainland China | |||||
Total employee headcount (number) | 627 | 609 | 607 | 596 | 577 |
Full-time (number) | 627 | 609 | 607 | 596 | 577 |
Part-time (number) | 0 | 0 | 0 | 0 | 0 |
Permanent (average %) | 75.6 | 75.3 | 71.6 | 72.1 | 71.9 |
Fixed-term contract (average %) | 24.4 | 24.7 | 28.4 | 27.9 | 28.1 |
Australia | |||||
Total employee headcount (number) | 2,281 | 2,320 | 2,280 | 2,246 | 2,196 |
Full-time (number) | 2,096 | 2,126 | 2,075 | 2,042 | 1,998 |
Part-time (number) | 185 | 194 | 205 | 204 | 198 |
Permanent (average %) | 95.1 | 94.0 | 94.5 | 95.9 | 96.0 |
Fixed-term contract (average %) | 4.9 | 6.0 | 5.5 | 4.1 | 4.0 |
India | |||||
Total employee headcount (number) | 437 | 442 | 469 | 458 | 463 |
Full-time (number) | 437 | 442 | 469 | 458 | 463 |
Part-time (number) | 0 | 0 | 0 | 0 | 0 |
Permanent (average %) | 97.4 | 98.4 | 98.8 | 99.0 | 99.4 |
Fixed-term contract (average %) | 2.6 | 1.6 | 1.2 | 1.0 | 0.6 |
- Starting from 2019, the numbers have included full-time and part-time employees. Numbers in the previous years included full-time employees only.
Contractor FTE and type | 2021 | 2020 | 2019 | 2018 | 2017 |
|---|---|---|---|---|---|
Group total (full-time equivalent)1 | |||||
Total contractor | 9,911.3 | 9,707.7 | 11,123.9 | 10,470.0 | N/A |
Labour supply2 | 1,329.9 | 1,423.9 | 1,573.0 | 1,577.0 | N/A |
Service contractor3 | 8,581.5 | 8,283.8 | 9,550.9 | 8,893.0 | N/A |
Hong Kong (full-time equivalent) | |||||
Total contractor | 5,202.8 | 4,949.9 | 6,372.6 | 5,308.6 | N/A |
Labour supply2 | 1,153.5 | 1,261.8 | 1,309.0 | 1,316.0 | N/A |
Service contractor3 | 4,049.3 | 3,688.1 | 5,063.6 | 3,992.6 | N/A |
Mainland China (full-time equivalent) | |||||
Total contractor | 576.0 | 361.2 | 363.2 | 423.9 | N/A |
Labour supply2 | 23.5 | 13.8 | 13.0 | 14.0 | N/A |
Service contractor3 | 552.5 | 347.4 | 350.2 | 409.9 | N/A |
Australia (full-time equivalent) | |||||
Total contractor | 1,368.0 | 1,926.5 | 1,856.2 | 1,785.0 | N/A |
Labour supply2 | 101.1 | 83.1 | 172.5 | 167.0 | N/A |
Service contractor3 | 1,266.9 | 1,843.4 | 1,683.7 | 1,618.0 | N/A |
India (full-time equivalent) | |||||
Total contractor | 2,764.6 | 2,470.1 | 2,531.9 | 2,952.5 | N/A |
Labour supply2 | 51.8 | 65.2 | 78.5 | 80.0 | N/A |
Service contractor3 | 2,712.8 | 2,404.9 | 2,453.4 | 2,872.5 | N/A |
- Numbers have been subject to rounding. Any discrepancies between the total shown and the sum of the amounts listed are due to rounding.
- Labour supply refers to manpower supplied by contractor companies under labour supply agreements. Reporting is based on quarterly averages.
- Estimated service contractor full-time equivalent (FTE) is calculated based on the number of manhours incurred and region-specific average weekly working hours since 2019. Numbers in 2018 are re-stated to reflect region-specific working hours instead of weekly hours of 48 for all regions.
Voluntary staff turnover rate | 2021 | 2020 | 20191 | 2018 | 2017 |
|---|---|---|---|---|---|
Hong Kong (%)2,3 | 4.6 | 3.1 | 2.4 | 2.3 | 1.9 |
By age group | |||||
Below 30 | 7.4 | 6.3 | 4.4 | 5.9 | 2.3 |
30-39 | 5.6 | 4.3 | 4.9 | 4.3 | 3.2 |
40-49 | 5.2 | 2.6 | 1.9 | 1.7 | 2.0 |
50 and above | 3.0 | 1.8 | 1.1 | 1.1 | 1.2 |
By gender | |||||
Male | 4.4 | 2.5 | 1.8 | 1.7 | 1.6 |
Female | 5.4 | 5.4 | 4.9 | 5.0 | 3.3 |
Mainland China (%)2,3 | 2.3 | 1.3 | 2.0 | 4.7 | 3.0 |
By age group | |||||
Below 30 | 6.7 | 1.4 | 8.4 | 16.4 | 8.8 |
30-39 | 1.9 | 2.9 | 1.9 | 5.2 | 3.3 |
40-49 | 2.5 | 0.5 | 0.5 | 1.5 | 1.5 |
50 and above | 0.0 | 0.0 | 0.0 | 0.0 | 0.0 |
By gender | |||||
Male | 2.1 | 1.4 | 2.4 | 4.1 | 2.4 |
Female | 2.9 | 0.9 | 0.0 | 7.5 | 5.3 |
Australia (%)2,3 | 16.1 | 7.7 | 12.9 | 13.6 | 13.8 |
By age group | |||||
Below 30 | 25.5 | 13.6 | 19.3 | 18.6 | 22.7 |
30-39 | 19.0 | 7.4 | 14.2 | 15.2 | 13.0 |
40-49 | 11.2 | 6.2 | 11.5 | 10.5 | 10.6 |
50 and above | 13.1 | 7.1 | 8.3 | 10.6 | 10.5 |
By gender | |||||
Male | 16.4 | 7.1 | 12.6 | 12.3 | 12.9 |
Female | 15.7 | 8.5 | 13.4 | 15.6 | 15.1 |
India (%)2,3 | 6.9 | 4.7 | 6.6 | 5.6 | 3.5 |
By age group | |||||
Below 30 | 12.5 | 5.6 | 7.4 | 6.4 | 4.6 |
30-39 | 7.5 | 5.7 | 9.3 | 7.2 | 3.4 |
40-49 | 4.8 | 4.7 | 2.9 | 2.9 | 3.0 |
50 and above | 5.1 | 0.0 | 0.0 | 2.5 | 2.9 |
By gender | |||||
Male | 6.6 | 4.3 | 6.4 | 5.6 | 3.2 |
Female | 9.4 | 7.4 | 7.5 | 5.7 | 6.0 |
- Starting from 2019, the numbers have included full-time and part-time employees. Numbers in the previous years included full-time employees only.
- Voluntary staff turnover refers to employees leaving the organisation voluntarily and does not include dismissal, retirement, company-initiated termination or end of contract.
- Includes permanent employees except for Mainland China, which includes both permanent and fixed-term contract employees due to local employment legislation.
New hire | 2021 | 2020 | 20191 | 2018 | 2017 |
|---|---|---|---|---|---|
Group total (number) | 1,029 | 711 | 857 | 965 | 835 |
By age group | |||||
Below 30 | 342 | 237 | 309 | N/A | N/A |
30-39 | 402 | 241 | 300 | N/A | N/A |
40-49 | 204 | 145 | 158 | N/A | N/A |
50 and above | 81 | 88 | 90 | N/A | N/A |
By gender | |||||
Male | 686 | 515 | 552 | 619 | 540 |
Female | 343 | 196 | 305 | 346 | 295 |
Hong Kong (number) | 524 | 408 | 348 | 307 | 292 |
By age group | |||||
Below 30 | 208 | 172 | 157 | N/A | N/A |
30-39 | 187 | 125 | 121 | N/A | N/A |
40-49 | 93 | 69 | 48 | N/A | N/A |
50 and above | 36 | 42 | 22 | N/A | N/A |
By gender | |||||
Male | 368 | 308 | 239 | 200 | 208 |
Female | 156 | 100 | 109 | 107 | 84 |
Mainland China (number) | 45 | 29 | 43 | 47 | 60 |
By age group | |||||
Below 30 | 24 | 10 | 16 | N/A | N/A |
30-39 | 16 | 10 | 25 | N/A | N/A |
40-49 | 4 | 8 | 2 | N/A | N/A |
50 and above | 1 | 1 | 0 | N/A | N/A |
By gender | |||||
Male | 37 | 25 | 36 | 41 | 49 |
Female | 8 | 4 | 7 | 6 | 11 |
Australia (number) | 433 | 255 | 423 | 582 | 435 |
By age group | |||||
Below 30 | 106 | 53 | 116 | N/A | N/A |
30-39 | 182 | 93 | 138 | N/A | N/A |
40-49 | 103 | 67 | 104 | N/A | N/A |
50 and above | 42 | 42 | 65 | N/A | N/A |
By gender | |||||
Male | 260 | 166 | 242 | 352 | 241 |
Female | 173 | 89 | 181 | 230 | 194 |
India (number) | 27 | 19 | 43 | 29 | 48 |
By age group | |||||
Below 30 | 4 | 2 | 20 | N/A | N/A |
30-39 | 17 | 13 | 16 | N/A | N/A |
40-49 | 4 | 1 | 4 | N/A | N/A |
50 and above | 2 | 3 | 3 | N/A | N/A |
By gender | |||||
Male | 21 | 16 | 35 | 26 | 42 |
Female | 6 | 3 | 8 | 3 | 6 |
- Starting from 2019, the numbers have included full-time and part-time employees. Numbers in the previous years included full-time employees only.
Employees eligible to retire within the next five years | 2021 | 2020 | 20191 | 2018 | 2017 |
|---|---|---|---|---|---|
Group total (%)2 | 14.6 | 14.5 | 13.9 | 16.4 | 15.1 |
Hong Kong (%)2 | 20.1 | 20.4 | 19.5 | 20.0 | 18.6 |
Mainland China (%)2 | 15.1 | 13.4 | 14.5 | 13.2 | 10.6 |
Australia (%)2,3 | 6.6 | 5.7 | 5.4 | 12.8 | 12.2 |
India (%)2 | 5.0 | 5.1 | 4.8 | 4.0 | 2.4 |
- Starting from 2019, the numbers have included full-time and part-time employees. Numbers in the previous years included full-time employees only.
- The percentages given refer to permanent employees within each region, who are eligible to retire within the next five years.
- There is no mandatory retirement age in Australia. Since 2019, the retirement age assumption has been adjusted from 60 to 65 to reflect local norms, which led to a significantly lower percentage compared to previous years. Numbers in previous years adopting the adjusted retirement age for Australia are as follows: 2017-Australia: 4.8% / Group total: 12.9%; 2018-Australia: 4.6% / Group total: 14.0%.
Talent and skills for the future
Technical trainees intake | 2021 | 2020 | 20191 | 2018 | 2017 |
|---|---|---|---|---|---|
Group total (number) | 89 | 79 | 75 | 85 | 117 |
Male | 71 | 68 | 64 | 67 | 89 |
Female | 18 | 11 | 11 | 18 | 28 |
Hong Kong (number) | 66 | 66 | 61 | 66 | 76 |
Male | 52 | 58 | 51 | 50 | 63 |
Female | 14 | 8 | 10 | 16 | 13 |
Mainland China (number) | 0 | 0 | 4 | 8 | 7 |
Male | 0 | 0 | 4 | 7 | 6 |
Female | 0 | 0 | 0 | 1 | 1 |
Australia (number) | 17 | 13 | 10 | 11 | 28 |
Male | 16 | 10 | 9 | 10 | 17 |
Female | 1 | 3 | 1 | 1 | 11 |
India (number) | 6 | 0 | 0 | 0 | 6 |
Male | 3 | 0 | 0 | 0 | 3 |
Female | 3 | 0 | 0 | 0 | 3 |
- Starting from 2019, the numbers have included full-time and part-time employees. Numbers in the previous years included full-time employees only.
Average training hours per employee | 2021 | 2020 | 20191 | 2018 | 2017 |
|---|---|---|---|---|---|
Group total (hours) | 51.6 | 42.5 | 40.1 | 46.1 | 46.9 |
By gender (hours) | |||||
Male | 58.2 | 47.7 | 44.8 | 51.6 | 52.4 |
Female | 33.3 | 27.6 | 26.8 | 28.5 | 29.5 |
By professional category (hours) | |||||
Managerial | 29.5 | 26.8 | 26.0 | 28.6 | 28.3 |
Professional | 41.2 | 34.9 | 35.0 | 37.9 | 39.7 |
General & technical staff | 65.8 | 52.2 | 47.1 | 55.8 | 55.5 |
By region (hours) | |||||
Hong Kong | 60.8 | 49.5 | 47.6 | 55.2 | 57.5 |
Mainland China | 77.8 | 66.8 | 66.1 | 78.2 | 71.3 |
Australia | 26.8 | 23.2 | 22.1 | 21.1 | 18.8 |
India | 48.8 | 33.8 | 23.2 | 27.1 | 36.4 |
- Starting from 2019, the numbers have included full-time and part-time employees. Numbers in the previous years included full-time employees only.
Percentage of employees trained | 2021 | 2020 | 20191 | 2018 | 2017 |
|---|---|---|---|---|---|
Hong Kong (%) | 97.8 | 98.4 | 92.3 | 93.3 | 99.1 |
By gender | |||||
Male | 98.4 | 98.4 | 94.9 | 95.4 | 99.2 |
Female | 95.3 | 98.7 | 82.2 | 84.6 | 98.5 |
By professional category | |||||
Managerial | 90.6 | 96.0 | 80.6 | 87.8 | 98.7 |
Professional | 97.8 | 99.2 | 93.1 | 92.3 | 99.2 |
General & technical staff | 98.7 | 98.1 | 93.1 | 94.7 | 99.0 |
Mainland China (%) | 100.0 | 100.0 | 100.0 | 99.8 | 91.0 |
By gender | |||||
Male | 100.0 | 100.0 | 100.0 | 100.0 | 91.2 |
Female | 100.0 | 100.0 | 100.0 | 99.1 | 90.2 |
By professional category | |||||
Managerial | 100.0 | 100.0 | 100.0 | 100.0 | 100.0 |
Professional | 100.0 | 100.0 | 100.0 | 100.0 | 100.0 |
General & technical staff | 100.0 | 100.0 | 100.0 | 99.7 | 85.1 |
Australia (%) | 100.0 | 100.0 | 100.0 | 100.0 | 100.0 |
By gender | |||||
Male | 100.0 | 100.0 | 100.0 | 100.0 | 100.0 |
Female | 100.0 | 100.0 | 100.0 | 100.0 | 100.0 |
By professional category | |||||
Managerial | 100.0 | 100.0 | 100.0 | 100.0 | 100.0 |
Professional | 100.0 | 100.0 | 100.0 | 100.0 | 100.0 |
General & technical staff | 100.0 | 100.0 | 100.0 | 100.0 | 100.0 |
India (%) | 95.9 | 69.9 | 81.4 | 83.2 | 86.6 |
By gender | |||||
Male | 95.6 | 70.4 | 80.9 | 82.5 | 85.4 |
Female | 98.1 | 66.0 | 85.5 | 88.5 | 96.2 |
By professional category | |||||
Managerial | 96.8 | 58.6 | 87.9 | 93.4 | 79.3 |
Professional | 95.1 | 74.9 | 86.3 | 95.8 | 91.6 |
General & technical staff | 96.7 | 66.2 | 66.4 | 53.4 | 79.5 |
- Starting from 2019, the numbers have included full-time and part-time employees. Numbers in the previous years included full-time employees only.
Diversity and inclusion
Gender distribution of Group Executive Committee (GEC) members | 2021 | 2020 | 2019 | 2018 | 2017 |
|---|---|---|---|---|---|
Male (%)1 | 69.2 | 64.3 | 64.3 | 71.4 | 69.2 |
Female (%)1 | 30.8 | 35.7 | 35.7 | 28.6 | 30.8 |
- Includes Executive Director (Chief Executive Officer).
Gender distribution of employees | 2021 | 2020 | 20191 | 2018 | 2017 |
|---|---|---|---|---|---|
Group total (%)2 | |||||
Male | 73.7 | 74.0 | 74.0 | 76.1 | 76.2 |
Female | 26.3 | 26.0 | 26.0 | 23.9 | 23.8 |
Hong Kong (%) | |||||
Male | 78.3 | 79.3 | 79.4 | 80.1 | 81.0 |
Female | 21.7 | 20.7 | 20.6 | 19.9 | 19.0 |
Mainland China (%) | |||||
Male | 83.6 | 82.9 | 82.5 | 82.2 | 80.6 |
Female | 16.4 | 17.1 | 17.5 | 17.8 | 19.4 |
Australia (%)2 | |||||
Male | 58.7 | 58.4 | 57.9 | 62.6 | 61.4 |
Female | 41.3 | 41.6 | 42.1 | 37.4 | 38.6 |
India (%) | |||||
Male | 87.6 | 88.0 | 88.3 | 88.6 | 88.8 |
Female | 12.4 | 12.0 | 11.7 | 11.4 | 11.2 |
- Starting from 2019, the numbers have included full-time and part-time employees. Numbers in the previous years included full-time employees only.
- Data of other gender identities is tracked. It is statistically insignificant and is not separately disclosed.
Gender distribution by region and professional category | 2021 | 2020 | 20191 | 2018 | 2017 |
|---|---|---|---|---|---|
Hong Kong (%) | |||||
Managerial - male | 71.1 | 74.4 | 75.7 | 75.6 | 74.5 |
Managerial - female | 28.9 | 25.6 | 24.3 | 24.4 | 25.5 |
Professional - male | 74.5 | 75.7 | 75.2 | 76.7 | 78.0 |
Professional - female | 25.5 | 24.3 | 24.8 | 23.3 | 22.0 |
General & technical staff - male | 83.1 | 83.3 | 83.5 | 83.5 | 83.9 |
General & technical staff - female | 16.9 | 16.7 | 16.5 | 16.5 | 16.1 |
Mainland China (%) | |||||
Managerial - male | 77.8 | 84.8 | 78.9 | 76.5 | 73.3 |
Managerial - female | 22.2 | 15.2 | 21.1 | 23.5 | 26.7 |
Professional - male | 85.0 | 84.3 | 85.2 | 84.4 | 85.0 |
Professional - female | 15.0 | 15.7 | 14.8 | 15.6 | 15.0 |
General & technical staff - male | 82.9 | 81.9 | 81.0 | 81.1 | 78.2 |
General & technical staff - female | 17.1 | 18.1 | 19.0 | 18.9 | 21.8 |
Australia (%) | |||||
Managerial - male | 61.4 | 63.8 | 68.6 | 72.4 | 73.0 |
Managerial - female | 38.6 | 36.3 | 31.4 | 27.6 | 27.0 |
Professional - male | 56.8 | 55.9 | 54.5 | 57.6 | 56.1 |
Professional - female | 43.2 | 44.1 | 45.5 | 42.4 | 43.9 |
General & technical staff - male | 61.1 | 61.4 | 61.0 | 67.1 | 65.1 |
General & technical staff - female | 38.9 | 38.6 | 39.0 | 32.9 | 34.9 |
India (%) | |||||
Managerial - male | 90.3 | 89.7 | 90.9 | 93.4 | 94.8 |
Managerial - female | 9.7 | 10.3 | 9.1 | 6.6 | 5.2 |
Professional - male | 90.2 | 91.2 | 89.1 | 89.0 | 89.4 |
Professional - female | 9.8 | 8.8 | 10.9 | 11.0 | 10.6 |
General & technical staff - male | 84.1 | 84.3 | 84.9 | 85.7 | 84.8 |
General & technical staff - female | 15.9 | 15.7 | 15.1 | 14.3 | 15.2 |
- Starting from 2019, the numbers have included full-time and part-time employees. Numbers in the previous years included full-time employees only.
Gender diversity targets | 2021 | 2020 | 20191 | 2018 | 2017 |
|---|---|---|---|---|---|
Women in Leadership (%)2 | 30.5 | 27.3 | 24.2 | 22.9 | N/A |
Women in Engineering (%)3 | 12.3 | 11.5 | 11.4 | 10.9 | N/A |
- Starting from 2019, the numbers have included full-time and part-time employees. Numbers in the previous years included full-time employees only.
- Leadership positions are defined as positions at Hay Reference Level 19 and above.
- Employees with a bachelors' degree or above qualification in engineering.
Employee age distribution | 2021 | 2020 | 20191 | 2018 | 2017 |
|---|---|---|---|---|---|
Group total (%) | |||||
Below 30 | 12.8 | 13.1 | 13.6 | 14.6 | 15.6 |
30-39 | 30.6 | 29.7 | 29.3 | 28.2 | 28.1 |
40-49 | 26.5 | 26.2 | 26.2 | 26.3 | 25.6 |
50 and above | 30.2 | 31.0 | 30.9 | 30.9 | 30.7 |
Hong Kong (%) | |||||
Below 30 | 14.0 | 13.8 | 13.6 | 13.7 | 13.7 |
30-39 | 25.5 | 23.6 | 22.7 | 21.5 | 21.6 |
40-49 | 24.5 | 24.6 | 25.4 | 26.1 | 25.6 |
50 and above | 36.0 | 38.0 | 38.3 | 38.7 | 39.1 |
Mainland China (%) | |||||
Below 30 | 13.2 | 12.5 | 14.0 | 15.6 | 17.0 |
30-39 | 33.8 | 33.8 | 34.6 | 34.1 | 32.2 |
40-49 | 30.0 | 32.7 | 32.1 | 33.5 | 34.3 |
50 and above | 23.0 | 21.0 | 19.3 | 16.8 | 16.5 |
Australia (%) | |||||
Below 30 | 11.4 | 12.6 | 13.4 | 15.4 | 17.9 |
30-39 | 35.9 | 36.6 | 37.1 | 36.9 | 37.2 |
40-49 | 29.8 | 28.1 | 26.6 | 25.5 | 23.8 |
50 and above | 22.9 | 22.7 | 22.9 | 22.2 | 21.1 |
India (%) | |||||
Below 30 | 5.7 | 10.2 | 14.9 | 18.3 | 22.9 |
30-39 | 54.2 | 51.8 | 49.0 | 48.5 | 46.7 |
40-49 | 25.0 | 24.2 | 23.9 | 22.9 | 22.2 |
50 and above | 15.1 | 13.8 | 12.2 | 10.3 | 8.2 |
- Starting from 2019, the numbers have included full-time and part-time employees. Numbers in the previous years included full-time employees only.
Average length of service | 2021 | 2020 | 20191 | 2018 | 2017 |
|---|---|---|---|---|---|
Number of years | |||||
Hong Kong | 15.4 | 16.3 | 16.8 | 17.3 | 17.5 |
Mainland China | 12.3 | 12.0 | 11.4 | 13.7 | 13.7 |
Australia | 7.4 | 7.1 | 5.2 | 4.9 | 5.2 |
India | 8.1 | 7.6 | 7.2 | 6.8 | 6.1 |
- Starting from 2019, the numbers have included full-time and part-time employees. Numbers in the previous years included full-time employees only.
2021 data shaded in orange has been independently verified by PricewaterhouseCoopers. The assurance scope of past years' data can be found in previous Sustainability Reports.
Overview
Copy linkCopied link
CLP’s almost 18,000 employees and contractors contribute their energy, talent and shared values to customers, investors and stakeholders every day. CLP has long recognised that caring for people is integral to its success.
CLP strives to act as a responsible employer, meeting the expectations of the people that work for it – directly or indirectly – and the wider community. This means providing people with fair and decent work; safe, healthy, and productive work environments; long-term work; and support to achieve their full potential. It also means developing young people and ensuring everyone who works at CLP is treated fairly, with respect.
In transitioning to net-zero and taking advantage of the prospects that spring from the greater integration of Hong Kong into the Greater Bay Area, CLP will create new job opportunities directly and throughout its value chain, delivering economic value to communities across Asia Pacific. CLP also seeks to address broader social issues and create social value by fostering diversity and inclusion, promoting fair and ethical work practices, and strengthening employees’ wellbeing and resilience to enable them to thrive in the changes brought by energy transition.
Key stakeholders
- Employees, Community, Suppliers
Related material topics
- Fostering agility, diversity and inclusion
- Attracting and retaining future talent
- Aligning business activities with community, employee, and customer expectations
Workforce size and mix
Copy linkCopied link
GRI reference: 2-7, 2-8
The number of total employees rose, primarily due to recovery of activity in the second year of the pandemic. Utilisation of service contractors was slightly higher than in 2020, primarily reflecting skilled jobs created in Hong Kong and Mainland China to support decarbonisation projects, and a planned major overhaul of the Jhajjar Power Station in India.
To support growth, CLPe Solutions' new energy business in Hong Kong implemented a programme to offer permanent positions with enhanced pay and benefits to selected fixed-term contract staff, and to enhance pay and benefits for remaining contract staff. CLP Power in Hong Kong also offered more permanent roles to selected labour supply workers following a strategic review of the use of labour hire.
Employees and contractors by region
Employees | Contractors | Total | ||||||
|---|---|---|---|---|---|---|---|---|
Average FTE | Permanent % | Fixed-term contract % | Labour supply | Service contractor (c) | Contractors sub-total | Total workforce | Contractors in total workforce % | |
Hong Kong | 4,704.8 | 83.5 | 16.5 | 1,153.5 | 4,049.3 | 5,202.8 | 9,907.6 | 52.5% |
Mainland China | 620.0 | 75.6 | 24.4 | 23.5 | 552.5 | 576.0 | 1,196.0 | 48.2% |
Australia | 2,281.4 | 95.1 | 4.9 | 101.1 | 1,266.9 | 1,368.0 | 3,649.4 | 37.5% |
India | 430.9 | 97.4 | 2.6 | 51.8 | 2,712.8 | 2,764.6 | 3,195.5 | 86.5% |
Group total1 | 8,037.3 | 87.0 | 13.0 | 1,329.9 | 8,581.5 | 9,911.3 | 17,948.6 | 55.2% |
- Numbers have been subject to rounding. Any discrepancies between the total shown and the sum of the amounts listed are due to rounding.
Fair and ethical work practices
Copy linkCopied link
GRI reference: 2-23, 2-25, 2-30, 401-2, 402-1, 407-1, 408-1, 409-1
Standards and procedures
CLP’s human resources policies and procedures are intended to ensure compliance with all local laws and regulations in relation to compensation and dismissal, recruitment and promotion, working hours, rest periods, equal opportunity, diversity, non-discrimination and harassment, and those covering benefits and welfare in the markets in which it operates. CLP takes immediate action to investigate and address any suspected breaches or issues that are brought to its attention.
Beyond compliance, CLP recognises its responsibility to respect human rights at work, as laid out in international principles, standards, and laws. CLP is a signatory of the World Business Council for Sustainable Development’s (WBCSD) Call to Action for Business Leadership on Human Rights, and of the Good Employer Charter established by the Labour Department of Hong Kong, pledging to be an employee-oriented employer implementing good human resource management practices.
Human rights and labour standards
In addition to local legal compliance, CLP respects internationally recognised human rights relevant to its operations and requires its business partners and suppliers to do the same. The commitment to upholding human rights is outlined in CLP’s Group Labour Standards, which reference the United Nations Guiding Principles on Business and Human Rights and other international standards and set company-wide minimum standards on critical working conditions and the basic rights of employees in the workplace. CLP’s commitment is also integrated in its Value Framework and Responsible Procurement Policy Statement. EnergyAustralia has a Supplier Code of Conduct and, from 2021, commenced reporting annually on the risks of modern slavery in its operations and supply chains, as well as actions taken to address those risks.
Discrimination and Harassment
CLP aims to provide work environments that are free of harassment or discrimination on the basis of gender, physical or mental state, race, nationality, religion, age, family status or sexual orientation; or any other attribute recognised by the laws of the country in which the Company operates.
Use of temporary and contractor labour
CLP uses temporary labour for work that is time-bound or during peak activities and engages labour employed by third parties for non-core work and / or work requiring specialist skills. CLP is committed to taking a responsible approach to managing the costs and risks of its contingent workforce. This includes considering whether there is an optimal balance between the insourcing and outsourcing of capabilities and ensuring that the working hours and remuneration of workers employed by contractors are fair and reasonable.
Fair wages
CLP complies fully with any local legal requirements with respect to minimum wage, and in practice, its remuneration and benefits for permanent staff often significantly exceed local legal requirements. It is not Group policy or market practice to provide the same employment benefits to temporary staff as for regular permanent staff, however benefits for temporary staff are competitive with local market practice and meet or exceed local legal requirements. CLP monitors pay carefully to ensure that it is competitive and rewards employees for individual and company performance. Core employee benefits are reviewed regularly to ensure they are fit for purpose and sustainable.
Supporting people to speak up and acting on reports of wrongdoing
CLP’s businesses each have an employee grievance procedure in place that reflects the CLP Value Framework and any applicable local legal requirements. In the case of any employee having concerns, established procedures are followed to address grievances. These procedures ensure fairness and independence in the investigation process, and respect for the confidentiality of the parties involved. CLP’s Whistleblowing Policy is publicly accessible, enabling employees and related third parties to raise concerns about any irregularity through a confidential channel.
Monitoring and follow-up
CLP’s Value Framework and Group Labour Standards set a common framework of principles. Detailed policies in each country are fully compliant with local legislation. Regular refresher training is organised for employees on key topics such as refreshers on CLP's Code of Conduct and business practice review, the harassment-free workplace policy, and others.
CLP prohibits the employment of child labour or forced labour in any of its operations. The steps it takes to prevent such practices includes stringent checking and control procedures in selection and on-boarding processes.
Each year, CLP uses independent external consultants to benchmark remuneration and benefits with relevant recruitment markets. Decisions on remuneration are subject to the corporate governance process and the approval of the Board Human Resources & Remuneration Committee to ensure a balance between the interests of both employees and shareholders as key stakeholders.
CLP carries out independent audits of its human resources policies and procedures to proactively identify any risks of legal non-compliance and take remedial action if such risks are identified. Immediate action is taken to investigate and address any suspected breaches or issues that are brought to the Company’s attention.
Read more on breaches of the CLP Code of ConductGRI reference: 201-3
CLP’s Group Labour Standards were launched in early 2021. The Standards outline CLP’s commitment to international principles and conventions and provide more detail on how CLP delivers on these commitments through company-wide minimum standards on critical working conditions including fair and decent work and working hours, and the basic rights of employees in the workplace. Following launch, the standards were embedded into procurement requirements for labour hire suppliers in Hong Kong and tracking and monitoring of temporary manpower supply resources has been strengthened.
CLP did not identify any operation or supplier as having a significant risk of child labour, young workers exposed to hazardous work or forced or compulsory labour in 2021. There was no breach of laws and regulations in relation to child and forced labour across CLP in 2021. Additionally, no Group operation was identified in which the right to exercise freedom of association and collective bargaining was violated or at significant risk.
The Fair Wage Network awarded Fair Wage Certificates to CLP’s Hong Kong businesses in recognition of their wage policies, practices and progress made in the two years since the last award with respect to the employment status of technician trainees and pay and grade progression opportunities for technical staff.
Recognising its efforts to provide sustainable retirement benefits, CLP again received the Good Mandatory Provident Fund (MPF) Employer Award for the seventh consecutive year, e-Contribution Awards, and won the Best All-round MPF Employer Award from the MPF Schemes Authority in Hong Kong. CLP also received an award for the Best ORSO (Occupational Retirement) Scheme in the 2021 Best of the Best Country Awards granted by Asia Asset Management.
Talent and skills development
Copy linkCopied link
GRI reference: 404-2, 404-3
CLP has a comprehensive training and development framework in place, aligned to business objectives, to help people to perform competently in their current roles and prepare them for future business challenges and opportunities. CLP also invests in wider development for young people and to build future energy industry capability that is inclusive and accessible to all.
Standards and procedures
CLP’s strategic talent and leadership development approach seeks to attract, retain, and develop a diverse, multi-generational workforce, develop new skills, and share talent effectively across the portfolio of businesses. Internal development efforts are supplemented by external recruitment for new-to-CLP skills focused on innovation, digital and renewables capabilities.
Investing in youth and early careers
Addressing future skills needs, and ensuring adequate talent supply to the evolving energy industry, requires significant investment in promoting and encouraging young people to join CLP, and accelerating development in their early careers. CLP provides opportunities to young people in Hong Kong through mentoring programmes, partnerships with local and overseas institutions to offer work placements to secondary and tertiary-level students, internships for fresh graduates across a range of disciplines, technical apprenticeships and its Graduate Trainee Programme. The CLP Power Academy in Hong Kong offers programmes to provide an alternative to school leavers and working adults to pursue careers in the energy industry. CLP also participates in youth development schemes such as the Hong Kong SAR Government’s Greater Bay Area Youth Employment Scheme. In Mainland China, CLP supports local technicians and engineers to attain professional engineering qualifications.
Sustaining core skills and developing new skills for the future
Skills and safety training are provided to develop technical and functional competencies and behaviours. All CLP employees participate in an annual performance and development cycle. This provides ongoing feedback and coaching conversations, clarity in terms of expectations, understanding of how they contribute to CLP’s objectives, and support for individual development needs. Through this process, CLP also recognises and rewards individual performance and success. Employees are provided the opportunity for continuous learning and skill-building via online and face-to-face learning resources and programmes and can access company support for employee-initiated self-development.
Developing leaders for a Utility of the Future
CLP's strategy requires a diverse leadership team, with the resilience, agility, stakeholder management and change leadership skills to position CLP for growth, and high-quality succession leadership roles. CLP remains committed to filling most leadership roles internally.
Strategic, general management and talent development programmes are used to develop future leaders, with programmes delivered internally (in Hong Kong through the CLP Learning Institute and Power Academy) and in partnership with leading academic institutions including the International Institute for Management Development (IMD), the Ivey Business School, Tsinghua School of Economics and Management, Chatham House and the École Polytechnique Fédérale de Lausanne (EPFL). Expert briefings and workshops are conducted on the latest global economic, political and technological trends including energy transition, digital disruption, wellbeing and resilience.
Monitoring and follow-up
CLP conducts regular talent and capability reviews, underpinned by people analytics, focused on both general management and engineering streams. These reviews monitor and follow up on actions to address current and future gaps and opportunities, including the progress of development programmes, recruitment campaigns, initiatives to strengthen gender diversity and cross-business assignments. The effectiveness of this approach is measured against a range of key performance indicators, including retention of key talent, turnover, diversity and employee engagement measures, using developed people analytics tools. The Board Human Resources & Remuneration Committee reviews talent and capability progress annually.
Despite the challenges of recruitment and delivering training during the COVID-19 pandemic, CLP increased its investment in youth development, core skills training, leadership development programmes, as well as investing in the training systems and frameworks needed to become a Utility of the Future.
Find out how CLP resources for energy transition and growthFostering diversity and inclusion
Copy linkCopied link
Considering the nature of CLP’s business and the markets in which it operates, CLP has set addressing gender diversity as a Group-wide priority to ensure a sustainable workforce in the face of demographic trends, and to deliver a wider, positive social and economic contribution. Formal, aspirational Group-wide gender diversity targets have been set, reflecting UN Sustainable Development Goals:
- Women in Leadership target: To achieve gender balance in leadership positions by 2030 against a 2016 baseline of 22%;
- Women in Engineering target: For 30% of engineers to be female by 2030 compared to a 2016 baseline of 9%;
- Ensuring equal pay for work of equal value is maintained in all CLP Group businesses, that any gender pay equity gap is eliminated, and that CLP meets all relevant local compliance and disclosure standards.
Standards and procedures
CLP is a signatory to the International Energy Agency’s "Equal by 30" initiative, a commitment by public and private sector organisations to work towards gender equality in the energy sector by 2030, and to the Women’s Empowerment Principles established by the UN Global Compact and UN Women in India. Local Diversity and Inclusion Councils operate in Hong Kong, India and Australia to drive the Company's efforts on diversity.
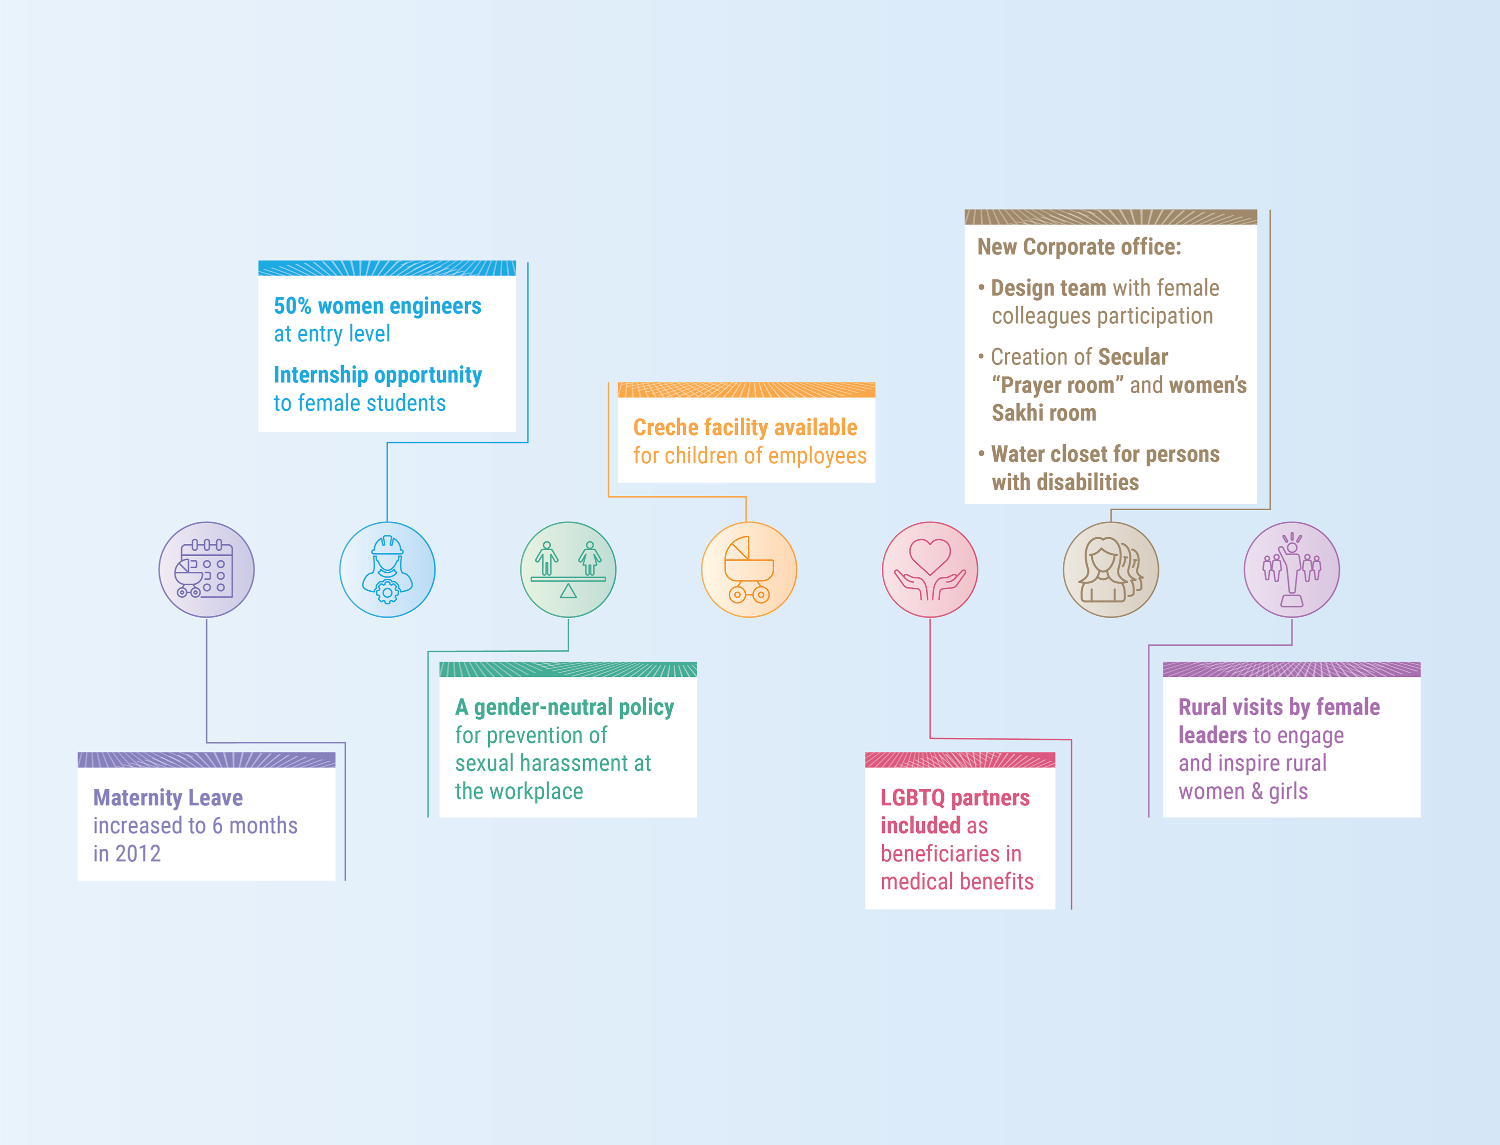
CLP’s human resources policies encourage the retention of employees through initiatives including flexible work arrangements, maternity leave, and other family-friendly policies and benefits. CLP’s recruitment processes are designed to be fair and non-discriminatory. In Hong Kong, this process follows the Equal Opportunities Commission Code of Practice, and includes the use of consistent selection criteria. In other parts of the Group, CLP complies with local legislation and codes of practice on recruitment. When conducting senior level searches, CLP also requires external recruitment firms to identify candidates with diverse backgrounds, in line with the Group's values.
Monitoring and follow-up
Gender progress is reviewed as part of regular general management and engineering talent reviews. The Board Human Resources & Remuneration Committee reviews progress against gender diversity targets annually. CLP also conducts regular reviews to identify any gender pay gaps and ensures equal pay for work of equal value.
GRI reference: 202-1, 202-2, 405-2
Against the targets, Women in Leadership increased to 30.5% (2020: 27.3%), while Women in Engineering increased to 12.3% (2020: 11.5%). Female representation in the Hong Kong Engineering Graduate intake increased from 19% in 2020 to 30% in 2021. Most women hired had participated in either CLP’s Female Engineering Student Mentoring Programme or had received an Engineering Study Award to support their final-year studies. Additionally, the 2021 Student Mentoring Programme ran virtually with 36 students.
Focus on ensuring strong female participation in development programmes continued with women representing over 30% of participants in senior leadership programmes, and 40% of participants in mid-level programmes. CLP’s Group-wide Female Engineering Network Programme, aimed at developing early to mid-career engineers, also continued.
Independent gender pay equity analysis for Hong Kong payroll, based on UK disclosure requirements, continued to show a reverse gender pay gap for both hourly pay and bonuses, due to a higher proportion of women in professional and managerial roles. Additionally, CLP was recognised for its support to the Hong Kong Equal Opportunities Commission Racial Diversity and Inclusion Charter for Employers.
Across the Group, EnergyAustralia refreshed and relaunched its Diversity and Inclusion strategy aiming to build a more consistent and measured approach to embed diversity and inclusion. Its LGBTIQ+ community network Prism was recognised with Silver Status at the 2021 Australian Workplace Equality Index Awards. Organisational awareness and understanding of Aboriginal and Torres Strait Islander culture continued to be built through education and training events. Apraava Energy established a local Diversity and Inclusion Council to create a roadmap for its activities and to accelerate progress.
Supporting employees to thrive in change
Copy linkCopied link
GRI reference: 401-2, 401-3, 404-2
This is achieved through a long-term focus on maintaining strong working relationships with employees and their representatives, providing flexible working arrangements and benefits to support employees through all life stages, strengthening their wellbeing and resilience, and providing support and reskilling to employees whose jobs are affected by the transition to net-zero or other business restructuring.
Standards and procedures
Offering flexible working
CLP aims to support employees through all life stages, from young people starting their careers to retirement. CLP recognises that people at different life stages may benefit from different working arrangements and promotes family-friendly leave policies and flexible working arrangements. CLP also offers a range of leave options to help its people achieve a good work-life balance, including parental and adoption leave, volunteering and study leave. In response to the COVID-19 pandemic, CLP has accelerated implementation of new ways for employees to connect virtually and perform their roles more flexibly, including flexible work policies and collaboration tools.
Investing in health, wellbeing, and strengthening resilience
CLP provides comprehensive support for physical, social, financial and emotional wellbeing and is working towards attaining ISO 45003:2021 certification for psychological health and safety at work from the International Organisation of Standardisation. Confidential employee assistance programmes are also offered to assist employees who may encounter work or personal issues and need professional support.
Keeping everyone informed and engaged
CLP’s employee relations approach focuses on establishing and maintaining strong working relationships with employees, being proactive in consulting on any workplace changes, and providing opportunities for employees to raise concerns. CLP employees have the right to join organisations and professional bodies of their choice. CLP respects and fully complies with all legal requirements with regards to union membership and collective bargaining. In Australia, CLP engages in collective bargaining with approximately 800 employees via certified enterprise bargaining agreements approved by the independent workplace relations tribunal, the Fair Work Commission. These agreements cover most terms and conditions of employment, including notice periods, provisions for consultation and dispute resolution.
Supporting employees and communities affected by energy transition or restructuring
Comprehensive support is provided to employees whose jobs are affected by business change or restructuring. This includes support tailored to individual needs, including training and skills development, career planning, assistance for redeployment and financial counselling. It also includes engaging actively with local stakeholders from employee representative organisations to local educational institutions to ensure that study opportunities are developed to help meet both the needs of its people, and the region’s new and emerging industries.
Monitoring and follow-up
CLP uses independent external consultants to conduct regular employee engagement surveys to understand employees’ views. Surveys were conducted across its Hong Kong, Mainland China and EnergyAustralia workforces in 2020 with high response rates and improved employee engagement scores.
In Hong Kong, joint consultative committees have been established which act as an additional channel of communication between the Company and the employees’ selected representatives. Employee benefits are regularly benchmarked to ensure that appropriate support is provided.
Find out how CLP supports employees to thrive in change