


Asset management


SASB reference: IF-EU-000.B, IF-EU-000.D, IF-EU-000.E; GRI reference: EU1, EU2
Asset management
Fuel use | 2021 | 2020 | 2019 | 2018 | 2017 |
|---|---|---|---|---|---|
Coal consumed (for power generation) (TJ)1 | 426,190 | 403,379 | 485,453 | 521,568 | 471,976 |
Gas consumed (for power generation) (TJ)1 | 142,304 | 134,776 | 107,183 | 83,364 | 91,426 |
Oil consumed (for power generation) (TJ)1 | 2,717 | 2,243 | 2,620 | 3,807 | 5,069 |
- Numbers include operating assets where CLP has operational control during the calendar year. Paguthan Power Station, the power purchase agreements of which expired in December 2018, was not included in the 2019-2021 numbers.
Generation and energy storage capacity | 2021 | 2020 | 2019 | 2018 | 2017 |
|---|---|---|---|---|---|
On an equity basis | |||||
Total generation and energy storage capacity by asset type (MW(%))1,2 | 20,018 (100%) | 19,691 (100%) | 19,238 (100%) | 19,108 (100%) | 19,395 (100%) |
Coal | 10,795 (53.9%) | 10,765 (54.7%) | 10,765 (56.0%) | 10,765 (56.3%) | 11,401 (58.8%) |
Gas | 4,666 (23.3%) | 4,600 (23.4%) | 4,194 (21.8%) | 4,147 (21.7%) | 3,434 (17.7%) |
Nuclear | 1,600 (8.0%) | 1,600 (8.1%) | 1,600 (8.3%) | 1,600 (8.4%) | 1,600 (8.2%) |
Wind3 | 1,747 (8.7%) | 1,521 (7.7%) | 1,521 (7.9%) | 1,521 (8.0%) | 1,941 (10.0%) |
Hydro3 | 489 (2.4%) | 489 (2.5%) | 489 (2.5%) | 489 (2.6%) | 489 (2.5%) |
Solar3 | 499 (2.5%) | 499 (2.5%) | 451 (2.3%) | 369 (1.9%) | 321 (1.7%) |
Waste-to-energy3 | 7 (0.0%) | 7 (0.0%) | 7 (0.0%) | 7 (0.0%) | N/A |
Energy Storage | 5 (0.0%) | 0 (0.0%) | N/A | N/A | N/A |
Others | 210 (1.0%) | 210 (1.1%) | 210 (1.1%) | 210 (1.1%) | 210 (1.1%) |
On an equity plus long-term capacity and energy purchase basis | |||||
Total generation and energy storage capacity by asset type (MW(%))1,2,4 | 25,108 (100%) | 24,752 (100%)5 | 24,015 (100%) | 23,705 (100%) | 24,554 (100%) |
Coal | 12,027 (47.9%) | 11,997 (48.5%) | 11,997 (50.0%) | 11,997 (50.6%) | 12,633 (51.4%) |
Gas | 5,813 (23.2%) | 5,717 (23.1%) | 5,139 (21.4%) | 5,084 (21.4%) | 5,322 (21.7%) |
Nuclear | 2,685 (10.7%) | 2,685 (10.8%) | 2,685 (11.2%) | 2,685 (11.3%) | 2,488 (10.1%) |
Wind6 | 2,331 (9.3%) | 2,105 (8.5%)5 | 2,049 (8.5%) | 1,982 (8.4%) | 2,401 (9.8%) |
Hydro6 | 489 (1.9%) | 489 (2.0%) | 489 (2.0%) | 489 (2.1%) | 489 (2.0%) |
Solar6 | 793 (3.2%) | 793 (3.2%) | 745 (3.1%) | 558 (2.4%) | 321 (1.3%) |
Waste-to-energy6 | 10 (0.0%) | 10 (0.0%) | 10 (0.0%) | 10 (0.0%) | N/A |
Energy Storage | 660 (2.6%) | 655 (2.6%) | N/A | N/A | N/A |
Others | 300 (1.2%) | 300 (1.2%) | 900 (3.7%) | 900 (3.8%) | 900 (3.7%) |
- Numbers have been subject to rounding. Any discrepancies between the total shown and the sum of the amounts listed are due to rounding.
- Starting from 2020, a new "Energy Storage” asset category is added, under which pumped storage and battery storage are included. In previous years, assets under the “Others” category included oil-fired generation assets and pumped storage.
- Renewables include wind, hydro, solar and waste-to-energy. The total capacity of renewables on an equity basis is 2,743 MW (13.7%) in 2021.
- Numbers include assets with majority and minority shareholdings, and those under "long-term capacity and energy purchase" arrangements with CLP. Starting from 2018, "long-term capacity and energy purchase" has been defined as a purchase agreement with a duration of at least five years, and capacity or energy purchased being no less than 10MW.
- Restated as per updated data for Power Purchase Agreement (PPA) of Waterloo Wind Farm in Australia.
- Renewables include wind, hydro, solar and waste-to-energy. The total capacity of renewables on an equity plus long-term capacity and energy purchase basis is 3,624 MW (14.4%) in 2021.
Energy sent out | 2021 | 2020 | 2019 | 2018 | 2017 |
|---|---|---|---|---|---|
On an equity basis | |||||
Total energy sent out by asset type (GWh(%))1,2,3 | 73,113 (100%) | 68,699 (100%) | 70,949 (100%) | N/A | N/A |
Coal | 42,002 (57.4%) | 39,438 (57.4%) | 44,596 (62.9%) | N/A | N/A |
Gas | 13,233 (18.1%) | 12,390 (18.0%) | 9,979 (14.1%) | N/A | N/A |
Nuclear | 12,302 (16.8%) | 11,192 (16.3%) | 10,888 (15.3%) | N/A | N/A |
Wind4 | 2,959 (4.0%) | 2,886 (4.2%) | 2,924 (4.1%) | N/A | N/A |
Hydro4 | 1,668 (2.3%) | 1,879 (2.7%) | 1,758 (2.5%) | N/A | N/A |
Solar4 | 922 (1.3%) | 898 (1.3%) | 805 (1.1%) | N/A | N/A |
Waste-to-energy4 | 27 (0.0%) | 15 (0.0%) | 0 (0.0%) | N/A | N/A |
Energy Storage | 0 (0.0%) | 0 (0.0%) | N/A | N/A | N/A |
Others | 0 (0.0%) | 1 (0.0%) | 0 (0.0%) | N/A | N/A |
On an equity plus long-term capacity and energy purchase basis | |||||
Total energy sent out by asset type (GWh(%))1,2,3,5,6 | 91,183 (100%) | 85,949 (100%)7 | 88,573 (100%) | 100% | 100% |
Coal | 43,995 (48.2%) | 41,118 (47.8%) | 48,512 (54.8%) | 60% | 61% |
Gas | 18,461 (20.2%) | 17,157 (20.0%) | 13,073 (14.8%) | 12% | 15% |
Nuclear | 20,962 (23.0%) | 19,923 (23.2%) | 19,400 (21.9%) | 20% | 15% |
Wind8 | 4,611 (5.1%) | 4,445 (5.2%)7 | 4,474 (5.0%) | 8% | 9% |
Hydro8 | 1,668 (1.8%) | 1,879 (2.2%) | 1,758 (2.0%) | ||
Solar8 | 1,524 (1.7%) | 1,522 (1.8%) | 1,467 (1.7%) | ||
Waste-to-energy8 | 38 (0.0%) | 22 (0.0%) | 0 (0.0%) | N/A | N/A |
Energy Storage | -75 (-0.1%) | -118 (-0.1%) | N/A | N/A | N/A |
Others | 1 (0.0%) | 1 (0.0%) | -109 (0.1%) | 0% | 0% |
On an operational control basis | |||||
Total energy sent out (GWh)3 | 62,967 | 58,918 | N/A | N/A | N/A |
- Numbers and percentage figures have been subject to rounding. Any discrepancies between the total shown and the sum of the amounts listed are due to rounding.
- Starting from 2020, a new "Energy Storage” asset category has been added, under which pumped storage and battery storage are included. In previous years, assets under the “Others” category included oil-fired generation assets and pumped storage.
- Paguthan Power Station, the power purchase agreements of which expired in December 2018, was not included in the 2019-2021 number.
- Renewables include wind, hydro, solar and waste-to-energy. The total sent out of renewables on an equity basis is 5,576 GWh (7.6%) in 2021.
- Numbers include assets with majority and minority shareholdings, and those under "long-term capacity and energy purchase" arrangements with CLP. Starting from 2018, "long-term capacity and energy purchase" is defined as a purchase agreement with a duration of at least five years, and capacity or energy purchased being no less than 10MW.
- Only percentages are available for the years 2017-18.
- Restated as per updated data for Power Purchase Agreement (PPA) of Waterloo Wind Farm in Australia.
- Renewables include wind, hydro, solar and waste-to-energy. The total sent out of renewables on an equity plus long-term capacity and energy purchase basis is 7,840 GWh (8.6%) in 2021.
2021 data shaded in orange has been independently verified by PricewaterhouseCoopers. The assurance scope of past years' data can be found in previous Sustainability Reports.
Overview
Copy linkCopied link
Asset management refers to how CLP manages and utilises its assets to provide reliable, affordable and sustainable electricity services to customers and communities.
Interruptions of this service could significantly impact a region’s economy and the communities where CLP operates. The Company understands the important role it plays in providing and maintaining critical energy infrastructure.
A multi-pronged approach is taken to achieve effective asset management. Asset integrity must be optimised in its life cycle. Utilisation of different assets must be optimised in response to fluctuating demand, fuel prices and, increasingly, significant electricity supply from renewable sources. It is also critical to safeguard operational technology (OT) and information technology (IT) systems from cyber threats. IT security is particularly important to employees and customers to ensure personal information and data privacy is adequately protected.
Key stakeholders
- Customers, Suppliers, Communities, Employees
Related material topics
- Reinforcing resilience in a changing operating environment
- Reinforcing cyber resilience and data protection
Asset management system
Copy linkCopied link
Strategies and procedures
CLP’s AMS Standard was developed in 2016 to standardise essential practices in managing assets across the Group and ensure best practice. It accords with the ISO 55000 series of standards for asset management systems, as well as the ISO 31000 standards for risk management.
The AMS Standard is integrated into CLP’s Health, Safety and Environment (HSE) Management System and the Project Management Governance System (PMGS) Standards to manage the complete lifecycle of an asset.
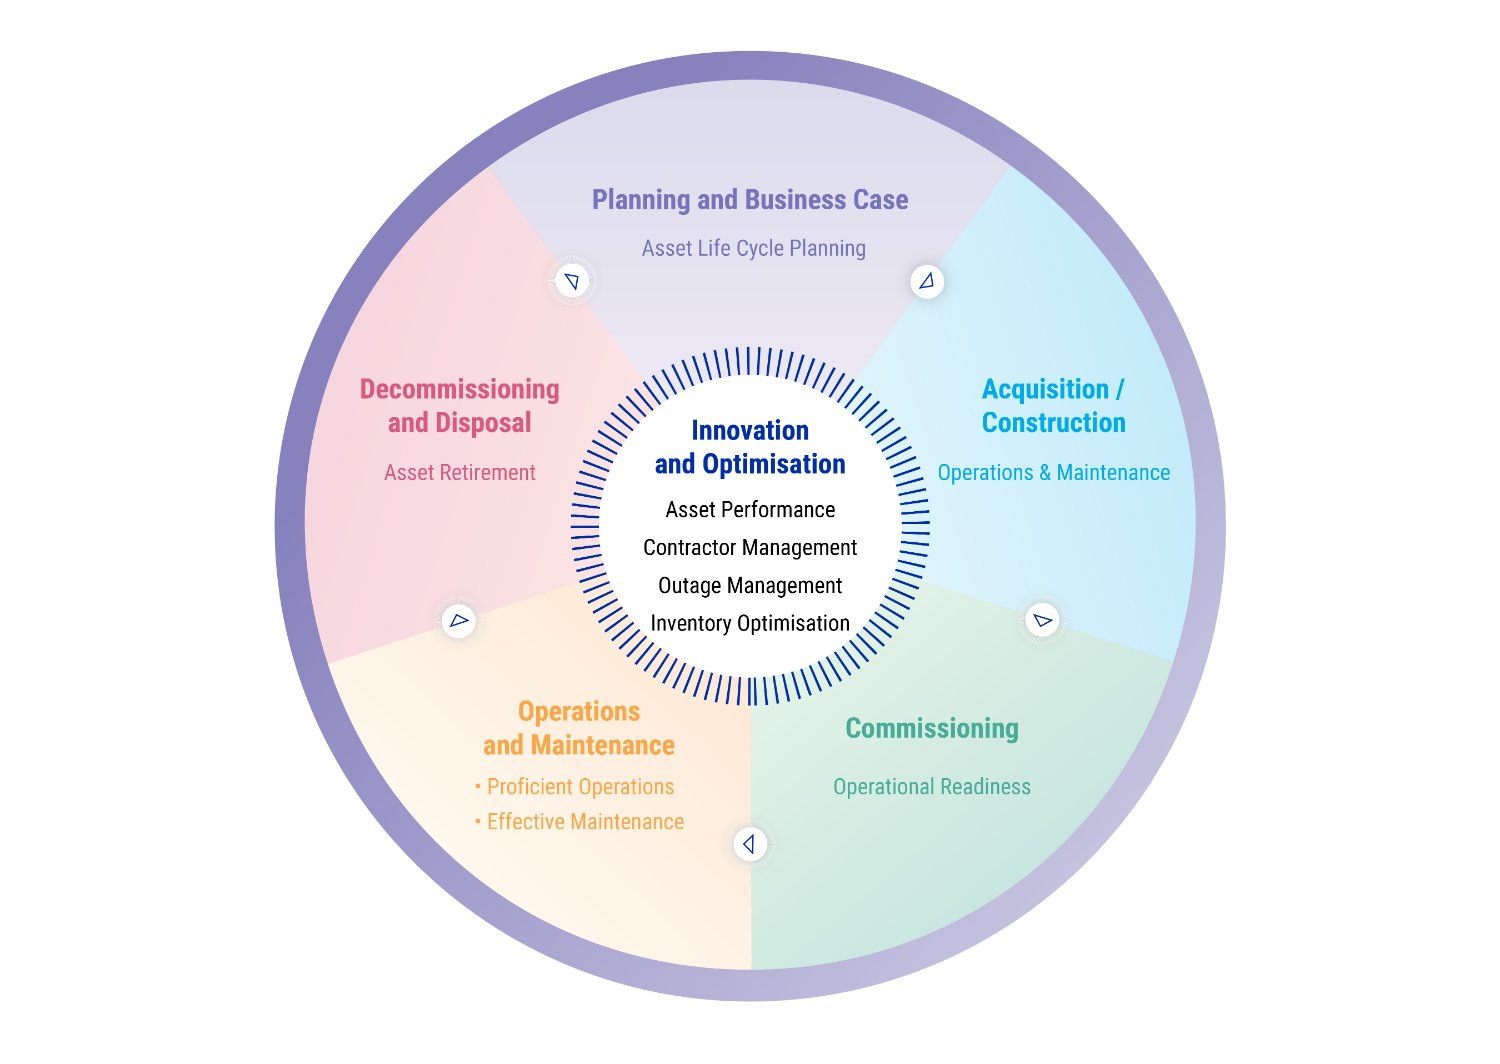
The AMS contains five key stages and 10 asset management elements, as illustrated in the diagram below.
Overview of the CLP asset management system
Monitoring and follow-up
CLP’s customised Group Operations Information System (GOIS) is used to compile operational data. It features built-in data collection, a data compilation and approval sequence, and dashboard and reporting functions. It follows the CLP Non-Financial Data Reporting and Assurance Standard to ensure robust data governance. Relevant staff at the asset, regional and Group levels have responsibility for upholding the standard.
Continuous improvement
Initial efforts at the project planning stage are critical in determining the operational efficiency or capacity factor range of an asset through its entire lifespan. Projects involving a major asset overhaul require stringent technical and financial scrutiny before commencement.
CLP constantly identifies opportunities to improve the operational efficiency of Group assets to help meet the increasingly stringent regulations on emissions and fuel efficiency in certain jurisdictions. There are also increasing improvement opportunities arising from innovation and optimisation, particularly from data analytics.
Asset performance
Copy linkCopied link
GRI reference: 301-1, 302-1, 302-3, 302-4, 302-5, EU11
The coal consumption increase in 2021 by 5.7% (vs. 2020) was primarily due to an increase in output at the Castle Peak Power Station in Hong Kong and the Jhajjar Power Station in India. At the same time, higher utilisation of gas - a cleaner fuel - at the Black Point Power Station in Hong Kong caused gas consumption to increase by 5.6% in the year.
CLP reports the annual operating performance of its generation assets which fall within the reporting scope. The asset performance metrics include availability, generation sentout, thermal efficiency and energy intensity.
Download CLP’s asset performance statisticsAnnual Fuel Consumed for Power Generation
Download data (excel)Compared to 2020, there was an overall increase in coal, natural gas and oil consumption for power generation in 2021 due to an increase in output.
Energy sent out (on an equity plus long-term capacity and energy purchase basis) by asset type1
Download data (excel)CLP's energy sent out from all asset-type increased in 2021 to meet the increased energy demand. The proportion of generation from different asset types remains relatively stable as compared to 2020.
- Percentage figures have been subject to rounding. Only the major asset types are shown here. For details, please refer to Asset management data table.
- Energy storage was categorised under "Others" prior to 2020.
- Energy storage was categorised under "Others" prior to 2020.
Security management
Copy linkCopied link
Strategies and procedures
CLP’s management of security is informed by the CLP Risk Management Framework, with oversight from the Board. The Group Security Policy was updated in 2021 to define the overarching approach taken to minimise risk to people, including employees, contractors, customers and the public, and to manage other business risks to acceptable levels.
The policy covers the following areas:
- Integrated and centralised organisation and governance: Group Security is an integrated department which covers all relevant lines of security activity within the Company, operating independently of the IT and OT governing organisations.
- Policies, standards and guidelines: a suite of documents provides guidance on how to manage and monitor risks in line with recognised industry standards.
- Understanding the threats: Ensuring decisions related to the application of security measures are appropriately informed and wherever possible, intelligence driven.
- Communications and awareness: Continuously enhancing the security awareness and knowledge of employees and contractors with the objective of encouraging security-positive behaviour.
- Technical domain: Ensuring that robust operational detection and response tools are developed, applied and maintained.
- Liaison: Maintaining constructive and trusted relationships with external stakeholders such as national cyber security agencies and industry bodies to ensure speedy and effective cooperation when the need arises.
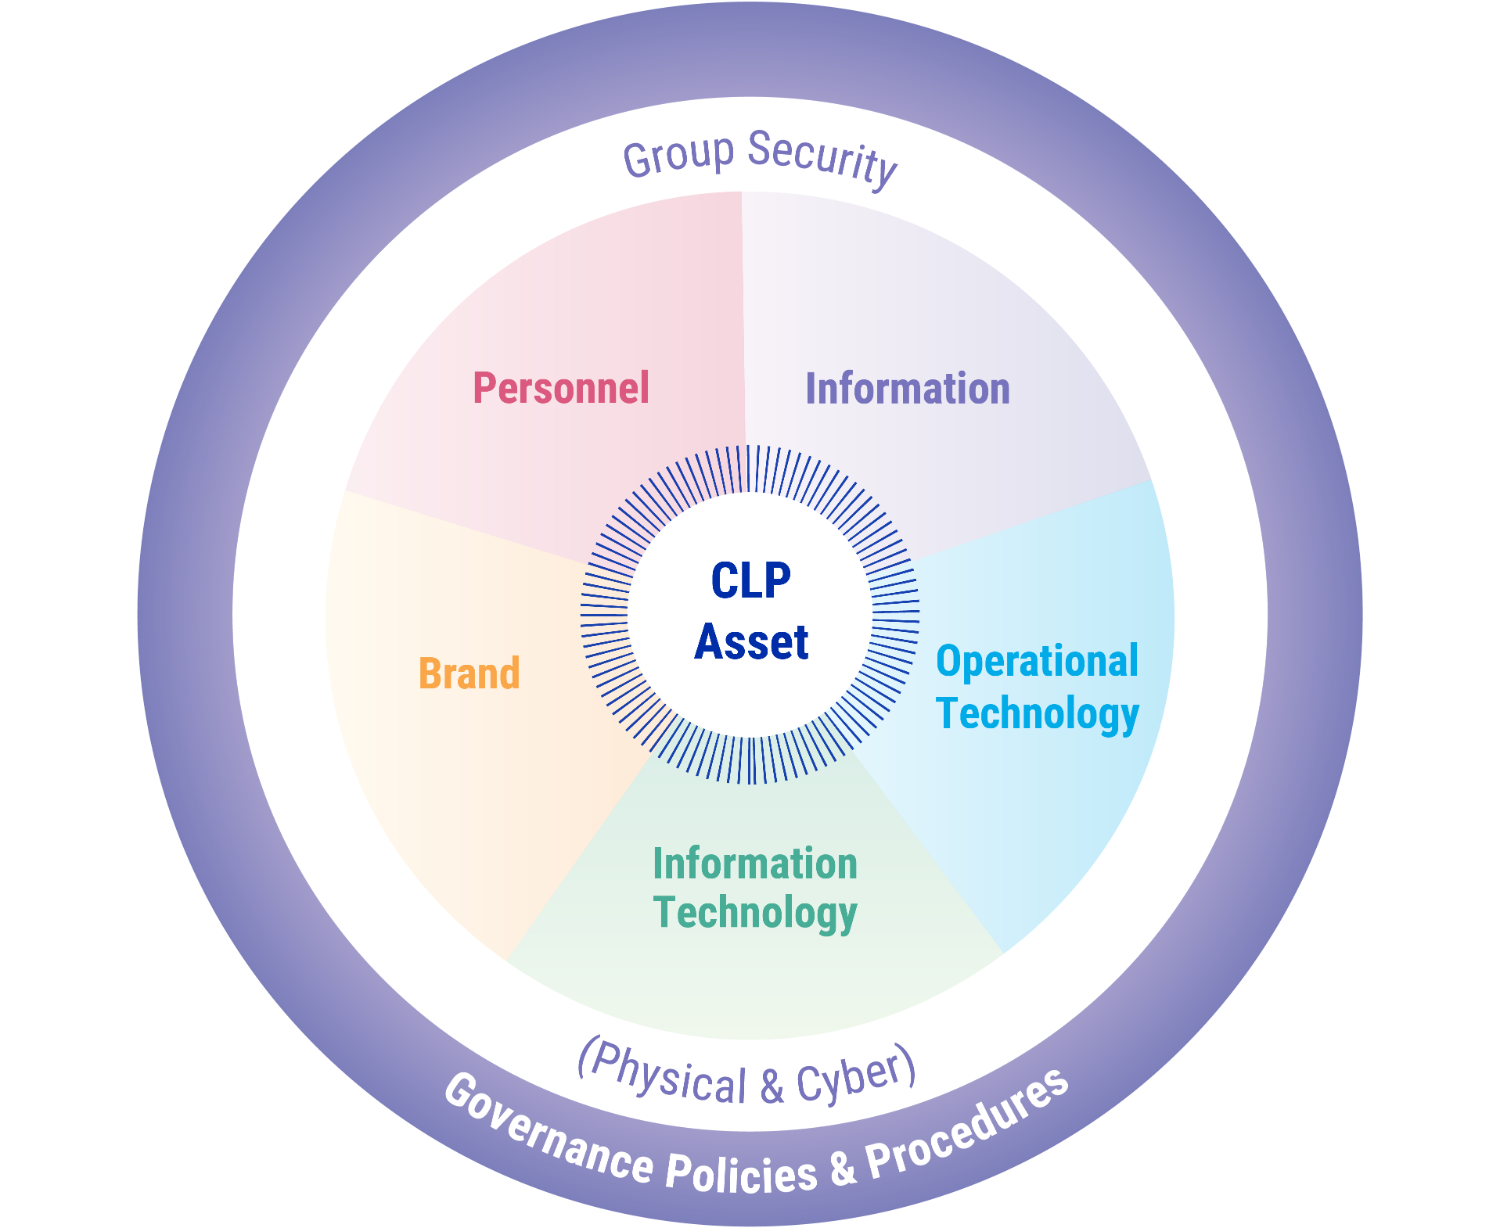
CLP’s approach to security is best understood using the diagram below.
There are five separate but co-dependent lines of activity, all of which are protected (to a lesser or greater extent) by cyber and physical security measures. These lines of activity are:
- Information: Data is stored in both hard and electronic formats. The confidentiality, integrity and availability of this data needs to be protected
- Operational Technology (OT): Hardware and software that detects, monitors or controls physical devices (such as a turbine) at CLP assets, needs to be protected
- Information Technology (IT): The IT used to store, retrieve, transmit, and manipulate data or information needs to be protected
- Personnel: Staff employed by CLP, both at the workplace and travelling for business, must be safe, and
- Brand: CLP’s image, identity and associated reputation needs to be protected.
CLP security measures are robust and scalable. Taken together, they provide comprehensive, layered and flexible protection.
CLP's approach to security
Operational responsibilities
The Group Security team was established in 2020 to ensure cyber and physical security capabilities and efforts complement each other. It is led by the Senior Director – Group Security, who is a highly experienced cyber security leader. This role reports directly to the Group Chief Operating Officer. The team offers an in-house capability across the full range of security skillsets. Drawing on internal security professionals and recruiting from wider industry, the Group Security function is separate from both the IT and the Health, Safety & Environment (HSE) departments.
Regular reports are provided to the Board’s Audit & Risk Committee (ARC). At CLP, one of the key responsibilities of the ARC is to seek assurance that adequate risk management is in place and followed, and that appropriate remedial action is taken where needed.
Read the Audit & Risk Committee’s reportPhysical security
Copy linkCopied link
GRI reference: 410-1
Strategies and procedures
Physical security refers to the physical measures designed to safeguard people, to prevent unauthorised access to equipment, facilities, material and documents, and to safeguard them against a security incident. It covers physical barriers (e.g. fences), security lighting, physical access control and surveillance systems.
A body of work has been developed to assist all regions and their assets in establishing or revising their security management documentation. These documents are aligned with international standards for security and contain best practices derived from across the Group.
- The CLP Physical Security Standard lays down the minimum standard of physical security measures expected at every asset owned and/or operated by CLP, regardless of location or role.
- The CLP Physical Security Guideline provides practical guidance on the security requirements expected of all business units, in line with the Group Security Policy and Physical Security Standard. For instance, it includes guidelines on how to identify potential areas of weakness, develop appropriate security countermeasures, as well as prepare a security response plan.
- The CLP Security Vulnerability Assessment Guideline is the flagship document that lays down the process of evaluating the security status of any CLP site. Using a risk-based approach and in close collaboration with the operator, it provides a comprehensive security “health check” covering threats, areas of weakness and offers solutions.
- CLP’s Security Due Diligence for Project Design & Construction or Site Acquisition has been developed to support projects in the early stages of an acquisition or a build. Based on the premise that early identification of potential problems can reduce risk and the cost of retrospective correction, all projects undergo this process, regardless of size.
- The CLP Business Travel Risk Management Plan seeks to minimise the security, medical and health risks faced by employees engaged in business travel. On behalf of the Group, Group Security leads on business travel security in close cooperation with Group HR and Finance.
Training and awareness
CLP security staff have a key role in preventing harm to staff and the wider public. All in-house security staff are required to comply with CLP’s Code of Conduct at all times and receive Code of Conduct training on an annual basis. In addition to training on national regulations and site-specific requirements, contract security staff receive induction training on CLP’s policies including: ensuring a harassment-free workplace; minimum wage guidelines; and measures preventing discrimination in the workplace. This induction training must be completed before personnel are granted access to their assigned workplace sites.
For a second successive year, business travel has all but stopped in response to the COVID-19 pandemic. More effort continues to be made in keeping staff across the Group informed on the rapidly changing travel situation and border closures across CLP's portfolio countries and other key destinations, as well as providing bespoke advice to those who have needed it.
Cyber security
Copy linkCopied link
Strategies and procedures
Cyber security refers to the need to protect CLP’s IT and OT systems:
- Operational Technology (OT) is the hardware and software that detects, monitors or controls physical devices (such as a turbine) at CLP assets.
- Information Technology (IT) is the technology used to store, retrieve, transmit, and manipulate data or information.
Cyber security incidents are unique in that the attack occurs in a virtual space and may not cause immediate disruption, as in the case of data leaks, making them difficult to detect or trace. As the workplace and operations are increasingly digitalised, electronic devices could become vulnerable to cyberattacks. It is therefore of utmost importance to improve the security culture within CLP and empower business units and regions to employ suitable technologies and processes to protect the Company’s assets and systems.
To this end, policies are in place to promote good security practice across the business:
- The CLP Group Information Security Policy sets out the four key information security principles of confidentiality, integrity, availability and regulatory compliance. With reference to ISO/IEC 27002:2013 Information Technology Security Techniques - Code of practice for information security controls, a set of Group-level policies have been developed. Regional standards and procedures have been developed from these policies and tailored to suit the context and local regulations of the business unit.
- The CLP Group Operational Technology Cyber Security Policy defines how to develop, implement and maintain appropriate safeguards to ensure the delivery of critical infrastructure services by CLP. One key focus relates to detection and response in cases of OT cyber security events, and to establish recovery capability on the OT systems.
With the policies and systems in place, an independent assurance team within the Group Security Department helps verify that the measures are followed consistently and that associated cyber security risks are suitably mitigated. The department’s evidence-based reporting provides an important feedback loop that enables the Company to pursue continuous improvement. In addition, the team helps project managers and business leaders understand cyber security risks in the context of CLP’s business, and offers guidance on risk mitigation strategies.
Training and awareness
People are another focus in cyber defence. Every employee and associate of the Group is an important cyber defence asset. They need to be equipped with relevant knowledge and vigilance.
CLP recognises the critical need to continually adapt and enhance its security posture to defend its operations against a complex and dynamic threat spectrum. Insight into the capability and intent of cyber attackers will help CLP develop situational awareness and give direction on what measures need to be taken to mitigate associated risks. Continual effort is given to raising cyber security awareness, training and education amongst employees to help them practise good “cyber hygiene”.
The Group has been further developing its cyber intelligence and security awareness capability throughout the year. There has been an enhanced understanding of threat actors and their techniques, ensuring, for example, that the business gets the option to prioritise software patching or to introduce other mitigation measures in a timely and effective manner. Security awareness activities at the employee level have included: simulated phishing emails, internal broadcast campaigns, briefings, videos and a popular cyber-gamified competition.
Monitoring and follow-up
CLP continually monitors its IT systems and networks and seeks out threats to its OT systems. Advances in cyber security technologies have helped improve the detection of cyber security breaches. If suspicious activity is discovered in the IT or OT network environments, immediate action is taken to investigate it and, if necessary, isolate the threat and lead the recovery action.
Throughout 2021, a coherent risk assessment matrix has been adopted to better measure and allow greater scrutiny of cyber risks in different business units.
Thorough reviews were conducted to help the Company identify areas for improvement. One study assessed CLP’s cyber security awareness and capacity, and highlighted the importance of deep cyber intelligence expertise. The other focused on areas for improvement in relation to incident response. These studies brought attention to the need for continual improvement and CLP has started to implement the recommendations, which will continue in the coming year.
Enhancing technology is another area of focus. Working together with IT and OT colleagues across the regions, vulnerability scanning tools and OT active response capabilities have been enhanced. With fine tuning and operator experience improving all the time, there have been fewer false positive notifications. In addition, to help different functions utilise the potential of cloud services, checklists and technical guidelines were developed to help them select the right vendors without compromising cyber integrity.
It is unlikely that cyber threats will be eliminated fully and CLP needs to stay vigilant at all times. Since power systems are considered critical infrastructure, different jurisdictions are also enacting more stringent regulations on cyber security in relation to critical infrastructure. Notably, in Mainland China, the PRC Data Security Law (DSL) became effective in September 2021. It sets up a framework that classifies data collected and stored in Mainland China based on its potential impact on Chinese national security and regulates its storage and transfer depending on the data’s classification level. Regulations on implementation of the DSL are under development. The Australian government also introduced the Security Legislation Amendment (Critical Infrastructure) Act 2021. Relevant business units have reviewed their information systems and business practices, to determine whether there is any compliance action that needs to be taken.
Cyber security continues to be one of CLP's top-tier risks and is regularly assessed and reported to senior management through the risk management process. In spite of further anticipated regulatory changes, and the fact that cyber security skillsets are scarce and recruitment is fiercely competitive, CLP will continue to seek to uplift its capacity in the area of process, people and technology, and to on-board the expertise required to spearhead the effort.
Read more from the 2021 Audit & Risk Committee ReportEmergency and crisis management
Copy linkCopied link
Strategies and procedures
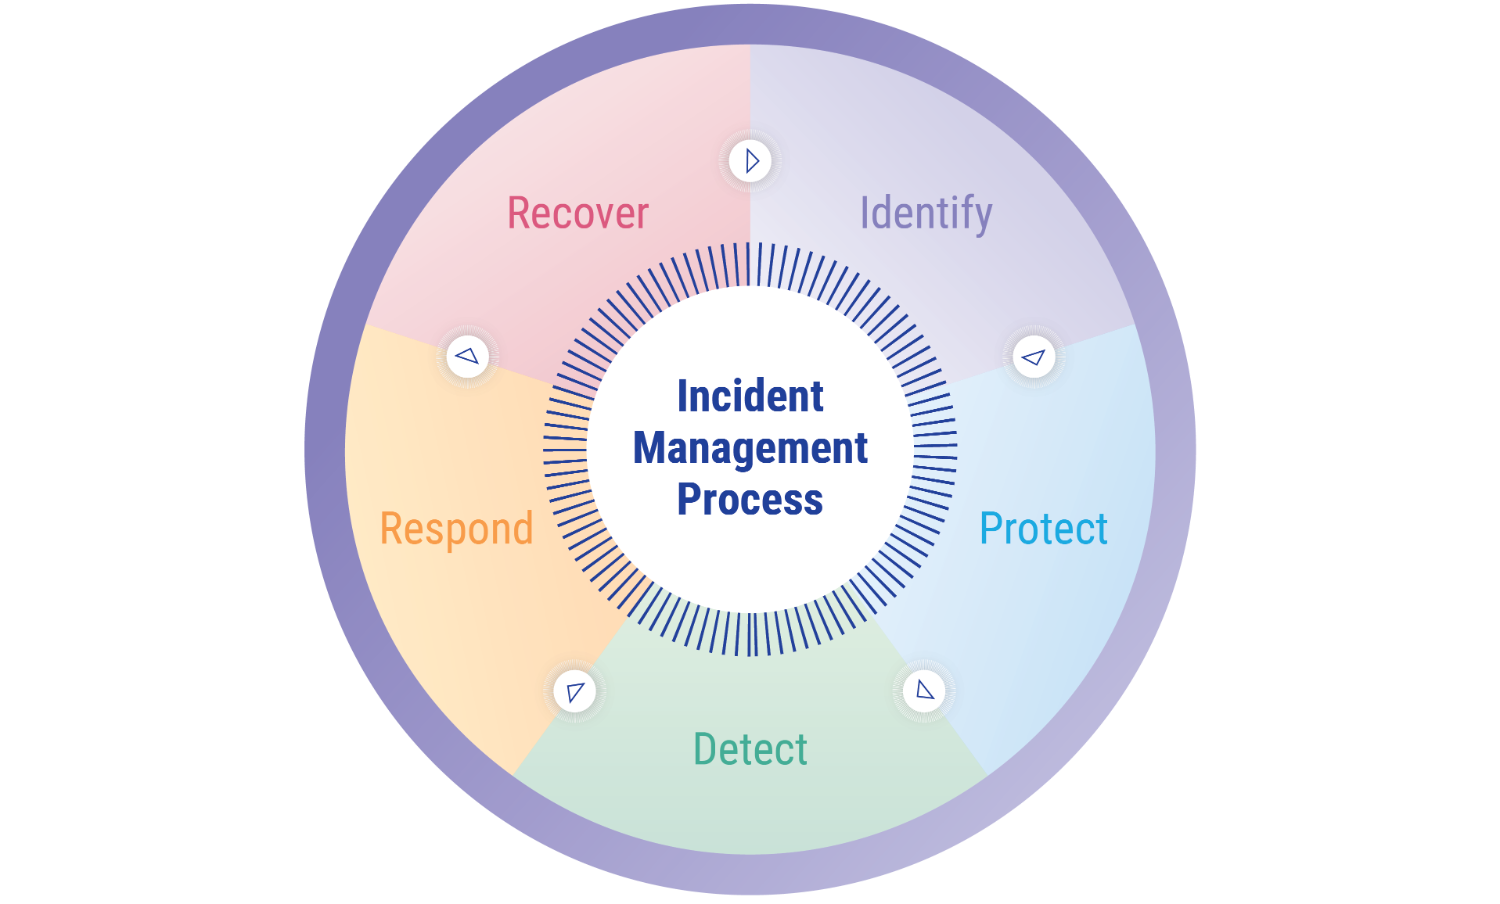
CLP maintains robust and regularly-tested emergency response and crisis management procedures. This ensures high levels of preparedness to respond to and recover from any emergency situations and helps minimise disruption to customers. As the first line of defence, when an incident arises the Incident Management Process (featured below) is followed.
CLP Incident Management Process
Crisis Management Plan
The Group Crisis Management Plan is in place to help respond to emergencies and crises that may cause business disruptions. The Plan is continually reviewed and enhanced to ensure it is in line with operational changes or the broader operating context. It provides a platform for the effective handling of a crisis at the Group level. The plan:
- Outlines crisis management organisation, roles, responsibilities, procedures and processes;
- Specifies the tools needed to ensure the collective response is well planned, well executed, and fully integrated across the organisation;
- Describes the relationship and interface between the handling of regional- and Group-level crises; and
- Details the processes that govern internal and external communications during emergencies and crises; ensuring the people responsible for managing a crisis have the necessary information to carry out their responsibilities and that key stakeholders are informed.
The Group-level plan is supported at regional level by Regional Crisis Management Plans which mirror the Group document but are tailored for each region. In addition, detailed emergency response plans have been developed for each asset. These plans are designed to be used by first responders and asset managers.
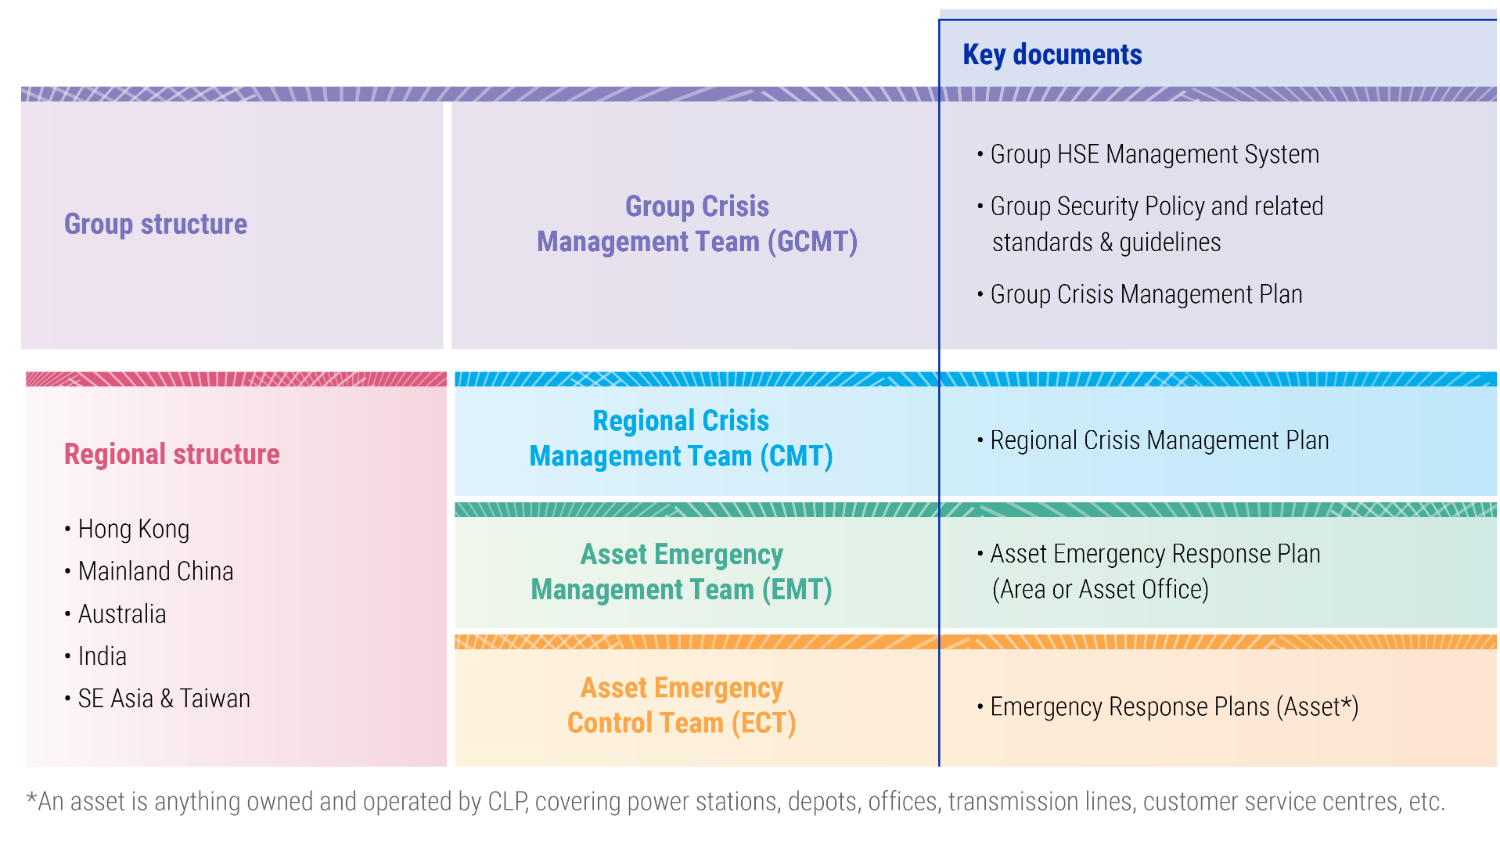
Details on CLP’s Crisis Management & Emergency Response Structure are outlined in the diagram below.
Training and awareness
As specified in both Group and regional publications, emergency response drills are conducted at least annually at all Group sites, with smaller scale drills taking place more often. Group and Regional Crisis Management Plans are reviewed at least every three years. Regional crisis management exercises are conducted annually as part of the internal peer review process.
CLP Crisis Management & Emergency Response Structure
Crisis management
From a crisis management perspective, the emphasis of the Company has been on maintaining and enhancing capability. Initiatives of the year included:
- Adopting cloud-based technology for CLP’s Crisis Communications Billboard (CCB) to better facilitate incident management
- Reviewing and improving notification and communication tools
- At Group level, conducting crisis management communications and administrative drills to ensure that the equipment and procedures are functional and fully understood by the operators.