


- At the Group level, Human and Organisational Performance & Learning Team training pilot programmes commenced in some of CLP's business units, providing staff with core skills to support their teams in learning and driving performance improvement. Central to the success of this programme is the formation of operational Learning Teams who will actively seek to understand and solve issues faced by those working on the frontline.
- EnergyAustralia continued to implement a new science-based safety programme called "Advanced Error Reduction in Organisations (AERO)". AERO provides tools to help employees understand their personality tendencies, so that they can more easily recognise and manage error traps associated with certain tasks. New Manual Handling programmes were initiated at Mount Piper and Yallourn.
- In Mainland China, Fangchenggang introduced a Safety Culture Transformation Team to uplift its safety culture and work safety through initiating a series of safety improvement programs and activities titled, “I want to be safe; I can be safe; I will be safe; Build safety together”.
Safety
Occupational health and safety
Group safety performance | 2021 | 2020 | 2019 | 2018 | 2017 |
|---|---|---|---|---|---|
Employees1 | |||||
Fatalities (number of personnel)2,3 | 0 | 0 | 0 | 1 | 0 |
Fatality Rate (number per 200,000 work hours)4,5 | 0.00 | 0.00 | 0.00 | 0.01 | 0.00 |
Days Away From Work Injuries (number of personnel)3,6 | 4 | 12 | 7 | 11 | 11 |
Lost Time Injury Rate | 0.05 | 0.13 | 0.07 | 0.13 | 0.13 |
High-consequence Injuries (number of personnel)8 | 0 | N/A | N/A | N/A | N/A |
Total Recordable Injury Rate | 0.14 | 0.25 | 0.19 | 0.19 | 0.21 |
Work-related Ill Health (number of personnel)3,10 | 1 | 0 | 0 | 1 | 0 |
Lost Days (number of days)11 | 30412 | 44313 | 46414 | 249 | 252 |
Contractors1 | |||||
Fatalities (number of personnel)2,3 | 0 | 0 | 1 | 1 | 4 |
Fatality Rate (number per 200,000 work hours)4,5 | 0.00 | 0.00 | 0.01 | 0.01 | 0.03 |
Days Away From Work Injuries (number of personnel)3,6 | 10 | 10 | 19 | 11 | 16 |
Lost Time Injury Rate | 0.08 | 0.09 | 0.14 | 0.09 | 0.14 |
High-consequence Injuries (number of personnel)8 | 1 | N/A | N/A | N/A | N/A |
Total Recordable Injury Rate | 0.29 | 0.37 | 0.52 | 0.29 | 0.36 |
Employees and contractors combined1 | |||||
Fatalities (number of personnel)2,3 | 0 | 0 | 1 | 2 | 4 |
Fatality Rate (number per 200,000 work hours)4,5 | 0.00 | 0.00 | 0.00 | 0.01 | 0.02 |
Days Away From Work Injuries (number of personnel)3,6 | 14 | 22 | 26 | 22 | 27 |
Lost Time Injury Rate | 0.07 | 0.11 | 0.11 | 0.10 | 0.13 |
High-consequence Injuries (number of personnel)8 | 1 | N/A | N/A | N/A | N/A |
Total Recordable Injury Rate | 0.23 | 0.32 | 0.38 | 0.25 | 0.29 |
- The system of rules applied in recording and reporting accident statistics complies with the International Labour Organization (ILO) Code of Practice on Recording and Notification of Occupational Accidents and Diseases.
- Refers to the number of fatalities as a result of work-related injury.
- Starting from 2021, the unit is changed from the number of cases to the number of personnel.
- Refers to the number of fatal injuries per 200,000 work hours in the year.
- Rates are normalised to 200,000 work hours, which approximately equals to the number of hours worked by 100 people in one year.
- Starting from 2021, “Days Away From Work Injuries” replaces “Lost Time Injury”. Days Away From Work Injuries refers to the number of personnel who sustains work-related injury and is unfit to perform any work on any day after the occurrence of the injury. “Any day” is any calendar day which includes rest days, weekend days, leave days, public holidays or days after ceasing employment. It does not include the day the injury incident occurred. “Days Away From Work Injuries” excludes fatalities which were included in “Lost Time Injury”. Numbers prior to 2021 are the previously reported numbers for “Lost Time Injury”.
- Refers to the number of Days Away From Work Injuries and Fatalities per 200,000 work hours in the year.
- Refers to the number of personnel who sustains life threatening or life-altering work-related injury. It is a subset of Days Away From Work Injuries.
- Refers to the number of Total Recordable Injuries per 200,000 work hours in the year. Total Recordable Injuries include Fatalities, Days Away From Work Injuries, Restricted Work Injuries, and Medical Treatment Injuries.
- Starting from 2021, “Work-related Ill Health” replaces “Occupational Disease”. Work-related Ill Health includes the diseases listed in the ILO List of Occupational Diseases, work-related mental illnesses and work-related disorders. Numbers prior to 2021 are the previously reported numbers for “Occupational Disease”.
- Starting from 2021, “Lost Days” replaces “Days Lost”. “Lost Days” is the sum total of calendar days (consecutive or otherwise) after the days on which the work-related injuries and work-related ill health occurred. “Days Lost” accounts the working days instead of calendar days. Numbers prior to 2021 are the previously reported numbers for “Days Lost”.
- 19 out of 304 days were carried forward from one incident in 2020.
- 188 out of 443 days were carried forward from one incident in the past.
- 158 out of 464 days were carried forward from three incidents in the past.
Regional safety performance | 2021 | 2020 | 20191 | 2018 | 2017 |
|---|---|---|---|---|---|
CLP Holdings2 | |||||
Employees | |||||
Fatalities (number of personnel) | 0 | 0 | 0 | 0 | 0 |
Fatality Rate (number per 200,000 work hours) | 0.00 | 0.00 | 0.00 | 0.00 | 0.00 |
Days Away from Work Injuries | 0 | 0 | 0 | 0 | 0 |
Lost Time Injury Rate | 0.00 | 0.00 | 0.00 | 0.00 | 0.00 |
High-consequence Injuries | 0 | N/A | N/A | N/A | N/A |
Total Recordable Injury Rate | 0.13 | 0.00 | 0.00 | 0.00 | 0.00 |
Work-related Ill Health (number of personnel) | 0 | 0 | 0 | 0 | 0 |
Lost Days (number of days) | 0 | 0 | 0 | 0 | 0 |
Contractors | |||||
Fatalities (number of personnel) | 0 | 0 | 1 | 0 | 0 |
Fatality Rate (number per 200,000 work hours) | 0.00 | 0.00 | 0.24 | 0.00 | 0.00 |
Days Away from Work Injuries | 0 | 0 | 2 | 0 | 0 |
Lost Time Injury Rate | 0.00 | 0.00 | 0.48 | 0.00 | 0.00 |
High-consequence Injuries | 0 | N/A | N/A | N/A | N/A |
Total Recordable Injury Rate | 0.22 | 0.00 | 0.48 | 0.00 | 0.00 |
Hong Kong2 | |||||
Employees | |||||
Fatalities (number of personnel) | 0 | 0 | 0 | 0 | 0 |
Fatality Rate (number per 200,000 work hours) | 0.00 | 0.00 | 0.00 | 0.00 | 0.00 |
Days Away from Work Injuries | 0 | 4 | 4 | 5 | 1 |
Lost Time Injury Rate | 0.00 | 0.09 | 0.09 | 0.10 | 0.02 |
High-consequence Injuries | 0 | N/A | N/A | N/A | N/A |
Total Recordable Injury Rate | 0.02 | 0.21 | 0.19 | 0.15 | 0.08 |
Work-related Ill Health (number of personnel) | 0 | 0 | 0 | 0 | 0 |
Lost Days (number of days) | 0 | 119 | 246 | 120 | 47 |
Contractors | |||||
Fatalities (number of personnel) | 0 | 0 | 0 | 0 | 4 |
Fatality Rate (number per 200,000 work hours) | 0.00 | 0.00 | 0.00 | 0.00 | 0.07 |
Days Away from Work Injuries | 4 | 5 | 15 | 5 | 9 |
Lost Time Injury Rate | 0.07 | 0.10 | 0.21 | 0.08 | 0.16 |
High-consequence Injuries | 0 | N/A | N/A | N/A | N/A |
Total Recordable Injury Rate | 0.14 | 0.30 | 0.51 | 0.20 | 0.29 |
Mainland China2 | |||||
Employees | |||||
Fatalities (number of personnel) | 0 | 0 | 0 | 0 | 0 |
Fatality Rate (number per 200,000 work hours) | 0.00 | 0.00 | 0.00 | 0.00 | 0.00 |
Days Away from Work Injuries | 0 | 2 | 0 | 0 | 0 |
Lost Time Injury Rate | 0.00 | 0.19 | 0.00 | 0.00 | 0.00 |
High-consequence Injuries | 0 | N/A | N/A | N/A | N/A |
Total Recordable Injury Rate | 0.00 | 0.19 | 0.10 | 0.00 | 0.00 |
Work-related Ill Health (number of personnel) | 0 | 0 | 0 | 0 | 0 |
Lost Days (number of days) | 19 | 59 | 0 | 0 | 0 |
Contractors | |||||
Fatalities (number of personnel) | 0 | 0 | 0 | 0 | 0 |
Fatality Rate (number per 200,000 work hours) | 0.00 | 0.00 | 0.00 | 0.00 | 0.00 |
Days Away from Work Injuries | 0 | 1 | 0 | 0 | 0 |
Lost Time Injury Rate | 0.00 | 0.10 | 0.00 | 0.00 | 0.00 |
High-consequence Injuries | 0 | N/A | N/A | N/A | N/A |
Total Recordable Injury Rate | 0.08 | 0.49 | 0.00 | 0.07 | 0.06 |
Australia2 | |||||
Employees | |||||
Fatalities (number of personnel) | 0 | 0 | 0 | 1 | 0 |
Fatality Rate (number per 200,000 work hours) | 0.00 | 0.00 | 0.00 | 0.04 | 0.00 |
Days Away from Work Injuries | 4 | 6 | 3 | 6 | 10 |
Lost Time Injury Rate | 0.18 | 0.25 | 0.10 | 0.26 | 0.43 |
High-consequence Injuries | 0 | N/A | N/A | N/A | N/A |
Total Recordable Injury Rate | 0.45 | 0.46 | 0.31 | 0.44 | 0.60 |
Work-related Ill Health (number of personnel) | 1 | 0 | 0 | 1 | 0 |
Lost Days (number of days) | 285 | 265 | 218 | 129 | 205 |
Contractors | |||||
Fatalities (number of personnel) | 0 | 0 | 0 | 1 | 0 |
Fatality Rate (number per 200,000 work hours) | 0.00 | 0.00 | 0.00 | 0.06 | 0.00 |
Days Away from Work Injuries | 5 | 2 | 2 | 4 | 6 |
Lost Time Injury Rate | 0.40 | 0.11 | 0.12 | 0.26 | 0.62 |
High-consequence Injuries | 0 | N/A | N/A | N/A | N/A |
Total Recordable Injury Rate | 0.97 | 0.44 | 0.62 | 1.09 | 1.85 |
India2 | |||||
Employees | |||||
Fatalities (number of personnel) | 0 | 0 | 0 | 0 | 0 |
Fatality Rate (number per 200,000 work hours) | 0.00 | 0.00 | 0.00 | 0.00 | 0.00 |
Days Away from Work Injuries | 0 | 0 | 0 | 0 | 0 |
Lost Time Injury Rate | 0.00 | 0.00 | 0.00 | 0 | 0.00 |
High-consequence Injuries | 0 | N/A | N/A | N/A | N/A |
Total Recordable Injury Rate | 0.00 | 0.00 | 0.00 | 0.00 | 0.00 |
Work-related Ill Health (number of personnel) | 0 | 0 | 0 | 0 | 0 |
Lost Days (number of days) | 0 | 0 | 0 | 0 | 0 |
Contractors | |||||
Fatalities (number of personnel) | 0 | 0 | 0 | 0 | 0 |
Fatality Rate (number per 200,000 work hours) | 0.00 | 0.00 | 0.00 | 0.00 | 0.00 |
Days Away from Work Injuries | 1 | 2 | 0 | 2 | 1 |
Lost Time Injury Rate | 0.03 | 0.07 | 0.00 | 0.06 | 0.03 |
High-consequence Injuries | 1 | N/A | N/A | N/A | N/A |
Total Recordable Injury Rate | 0.41 | 0.46 | 0.68 | 0.19 | 0.20 |
- Starting from 2019, CLPe Solutions has been reported under CLP Holdings to align with a change in internal reporting. Before that, it was reported under Hong Kong.
- The system of rules applied in recording and reporting accident statistics complies with the International Labour Organization (ILO) Code of Practice on Recording and Notification of Occupational Accidents and Diseases.
Nuclear safety | 2021 | 2020 | 2019 | 2018 | 2017 |
|---|---|---|---|---|---|
Workers | |||||
Collective radiation dosage for workers | 642 | 676 | 960 | 753 | 712 |
Nuclear-related waste | |||||
Spent nuclear fuel (t) | 33.1 | 37.7 | 75.2 | 37.6 | 39.7 |
Low- to intermediate-level radioactive nuclear waste (m3) | 26.0 | 71.0 | 89.4 | 79.0 | 89.2 |
2021 data shaded in orange has been independently verified by PricewaterhouseCoopers. The assurance scope of past years' data can be found in previous Sustainability Reports.
Overview
Copy linkCopied link
Caring for people is one of the core components of CLP’s Value Framework. The continued health and safety of all parties is always a top priority for the Group.
While stakeholder expectations continually evolve, safety is fundamental; employees, contractors, customers and the communities in which CLP operates rightly expect to be free from harm while on or near CLP premises.
Health and safety is even more pertinent in today’s pandemic reality. Social distancing, temperature monitoring and enhanced hygiene measures are the new normal. Equally important is mental health and wellbeing as many individuals continue to struggle with work-from-home or other COVID-19 pandemic-related restrictions.
As expected, safety and well-being continues to be a material topic for all CLP stakeholders, with a special focus on employees and contractors. The nature of the business potentially exposes individuals to high-risk activities. CLP is responsible for reducing risk by enacting appropriate safety measures or deploying technological solutions. CLP continually monitors the disclosure of metrics relating to customer safety and safety in nuclear plants where it has a non-majority stake.
Key stakeholders
- Customers, Communities, Employees, Suppliers
Related material topics
- Aligning business activities with community, employee and customer expectations
- Promoting workplace safety and wellbeing
Health, Safety, and Environment management
Copy linkCopied link
GRI reference: 403-1, 403-2
CLP's commitment to continually improving its HSE performance for the benefit of its employees, contractors, customers and the public, remains steadfast. This covers the construction of new projects, operations and decommissioning.
With the establishment of its independent Group Security function in May 2021, CLP removed physical security from the scope of its Health, Safety, Security and Environment (HSSE) Policy, and rolled out a new integrated HSE Policy. The HSE Policy sets out the high-level expectations driving the direction of the HSE Management System (HSEMS), which the Group is currently refreshing.
Download the HSE PolicyHSEMS core components and relationship
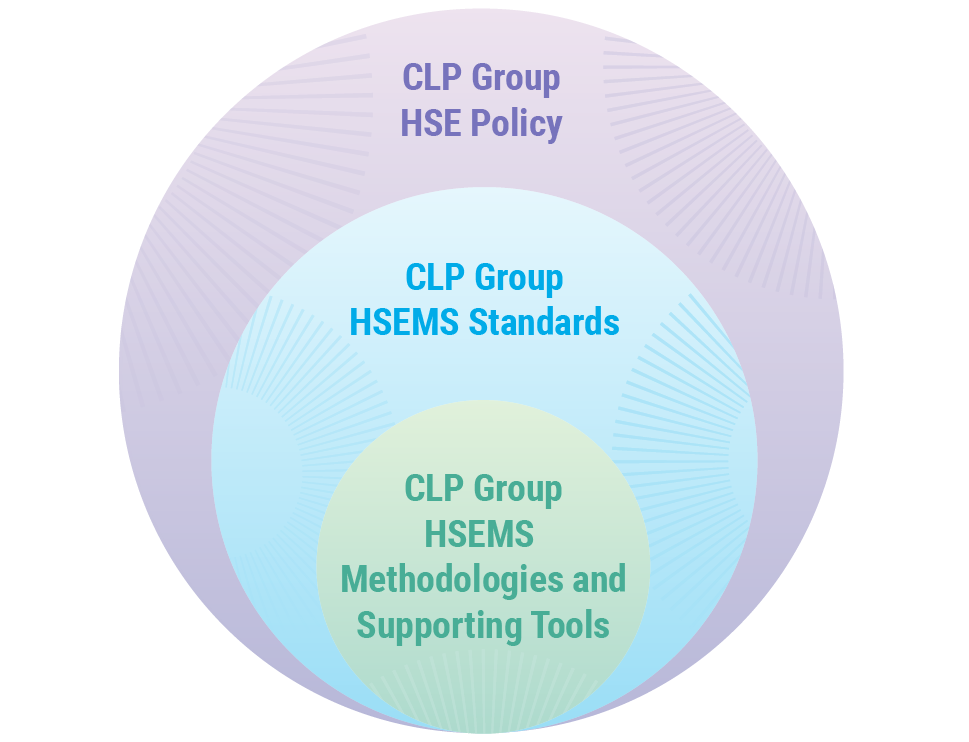
The diagram above shows the core components of the Group's HSEMS and their inter-relationships.
The HSEMS helps implement CLP's commitment to continually improving HSE performance and the requirements of the Group’s new HSE Policy. It is supported by a suite of standards with mandatory requirements, methodologies and other supporting tools.
The refresh of the HSEMS aims to:
- Establish a risk-based HSEMS to meet the objectives set out in the HSE Policy;
- Further improve clarification of mandatory requirements within the CLP HSEMS Standards;
- Enable the Group’s regional organisations to incorporate HSEMS Standards into their business programme; and
- Promote and encourage conformity to internationally accepted standards for occupational health and safety (ISO 45001) and environmental management (ISO 14001).
The transition to the refreshed system is progressing, and focuses on developing four areas of the existing HSEMS:
- Leadership and commitment;
- Planning and support;
- Operational enablers; and
- Monitoring, learning and improving.
Strategies and procedures
To support safe operations, CLP has in place a Health, Safety and Environment Improvement Strategy (HSE Improvement Strategy). It has clear objectives, focus areas and timelines, and sufficient resources to achieve its objectives, including HSE professionals and an appropriate budget.
Following the five pillars of the Group's HSE Improvement Strategy, an annual improvement programme is developed, approved and communicated to staff and contractors in each business unit. Recommendations are implemented on agreed timelines and programme processis monitored regularly. Read more in Occupational health and safety below.
Operational responsibilities
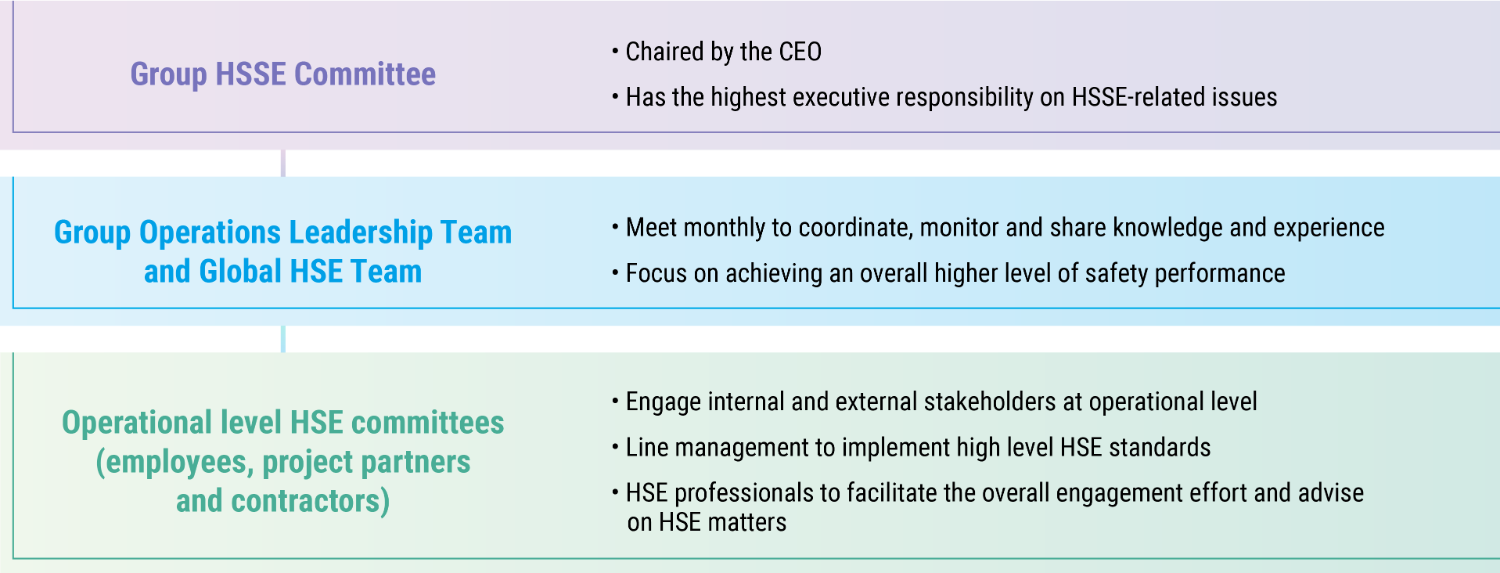
The Group HSSE Committee, chaired by the CEO, has the highest executive responsibility on HSSE-related issues. The Group Operations Leadership Team and the Global HSE Team conduct monthly meetings to coordinate, monitor and share knowledge and experience in HSE practices across the Group. Special focus is given to achieving an overall higher level of safety performance.
In addition, various HSE committees have been established to engage employees at the operational level. These committees also involve project partners and contractors. HSE professionals facilitate the overall engagement effort and advise on HSE matters, while the responsibility for implementing high levels of HSE standards rests with line management.
Hierarchy of operational responsibilities
Occupational health and safety
Copy linkCopied link
GRI reference: 403-1, 403-2, 403-3, 403-5, 403-7, 403-8
The CLP Group’s HSE Improvement Strategy in 2021 was based on five pillars, they are:
- Uplifting the safety culture;
- Rethinking risk;
- Involving stakeholders;
- Maintaining a healthy and engaged workforce; and
- Ensuring environmental sustainability.
Each pillar emphasises a key principle for effective HSE management. The pillars aim to uplift the Group’s safety culture across all operating regions, promote more proactive risk management, and engage employees, contractors and other key stakeholders in collectively implementing changes to improve safety performance.
Goals and targets
CLP is committed to ensuring all its activities and operations focus on the elimination of fatalities, life-changing injuries, and the occurrence of significant HSE events.
Monitoring and follow-up
The CLP Safety Performance Monitoring and Reporting Standard sets out the safety performance indicators and requirements of safety data reporting. The indicators show trends and can help identify areas which may require more attention to prevent an incident from occurring. CLP has used targeted engagements and worker insights to aide in the development of more comprehensive and effective incident prevention interventions.
Safety performance is reported internally on a monthly basis. Safety performance data and associated insights gained are collected and presented in the monthly meetings between the Group Operations Leadership Team and the Global HSE Team. The data and insights are also reported on a quarterly basis to the Group HSSE Committee, chaired by the Chief Executive Officer.
CLP’s Incident Management Standard sets out the minimum requirements for the implementation and maintenance of a safety incident management system across the Group. In the event of a major incident, the CLP Group Incident Investigation Panel (IIP) and Investigation Report Format Standard are followed. The IIP, chaired by senior members of staff from outside the business unit in which the accident occurred, conducts a thorough investigation. The IIP’s reports are critically reviewed by the Group Chief Operating Officer and the regional Managing Director. The intention is to identify the factors contributing to the incident and the actions required to prevent a recurrence.
Training and awareness
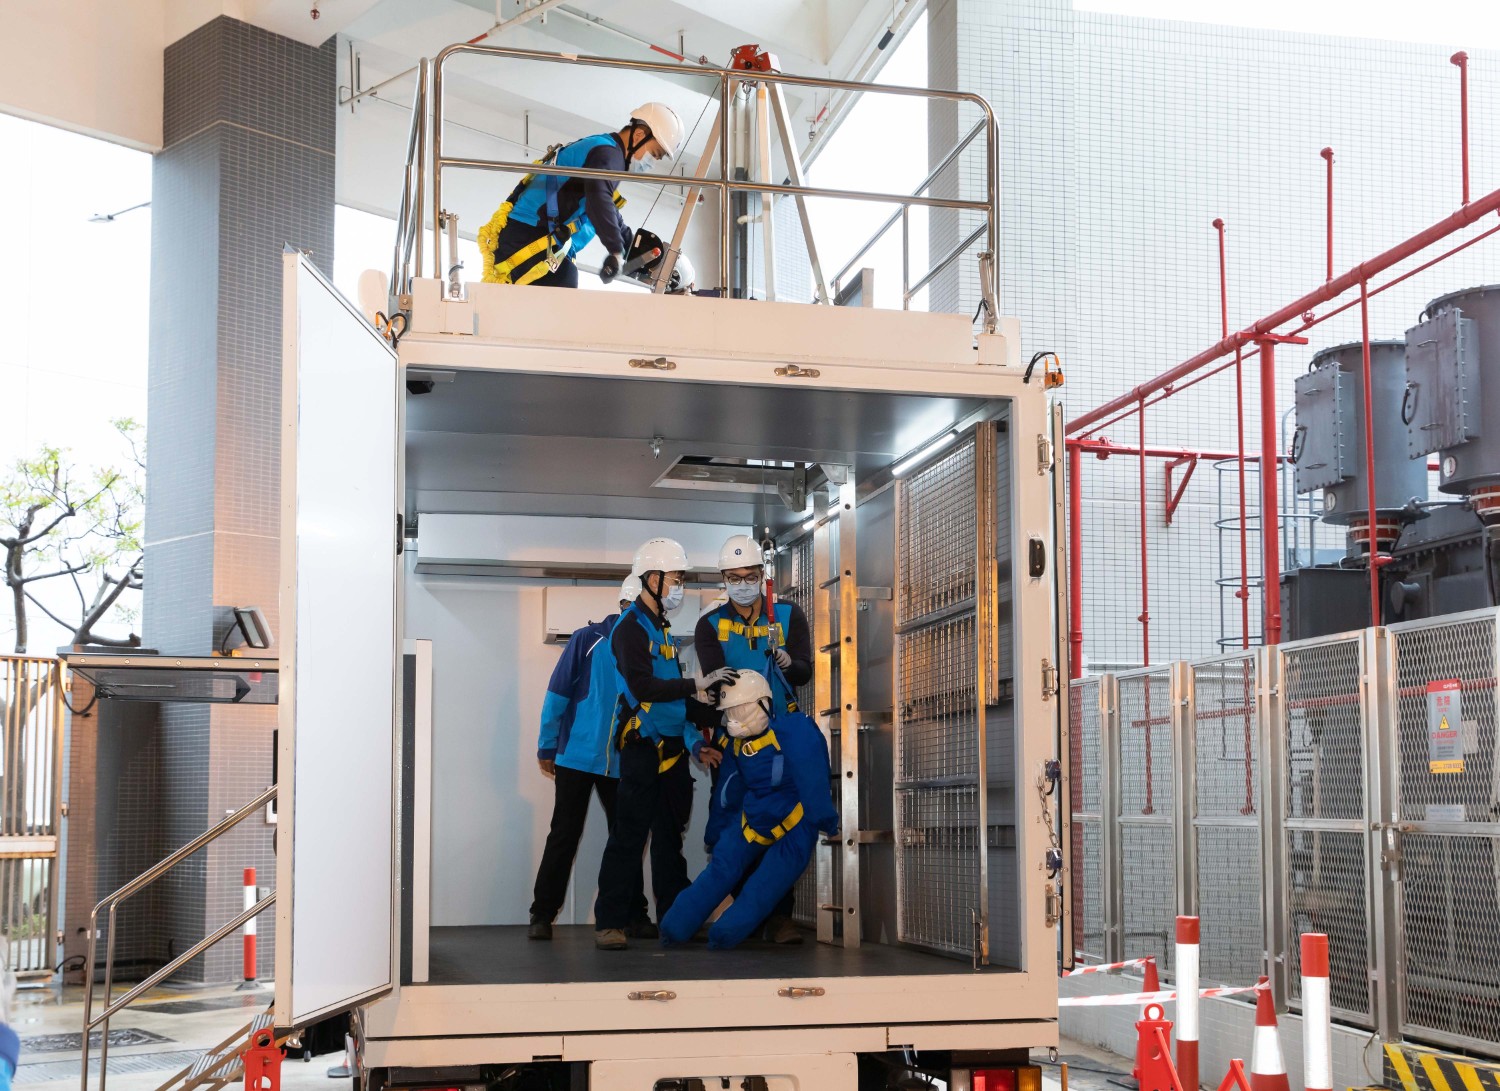
Personnel will only be asked to do work in areas in which they are deemed capable and competent to perform their roles. This requires the careful selection, placement, training, ongoing competency assessment and authorisation of employees, with third-party independent assessment where appropriate. A system is in place to identify and deliver the training necessary to ensure an individual's competence and knowledge in understanding the hazards, risks and control measures associated with their work.
At the asset level, there is flexibility to structure health and safety measures and design more specific approaches in providing relevant training. This includes monitoring the percentage of contractors who have undertaken this training. Safety training requirements are in all contracts and all contractors are expected to undergo safety training relevant to their duties. Spot checks are conducted to ensure compliance.
Continuous improvement
Thorough investigations are conducted into all incidents that have the potential to cause serious injuries. The aim is to move beyond simply looking at human error as a cause, and to understand the more complex latent conditions that contribute to incidents. CLP is committed to understanding how decisions and actions would be made by employees at a particular point in time in their work. CLP is also committed to learning from those closest to the work, to understand their challenges and identify practical improvement opportunities.
CLP is committed to ongoing efforts to find new and better ways of working by learning from investigations into incidents, as well as adopting best practices. For instance, in 2020, the Group conducted a significant overview of its operations involving underwater diving, with the express goal of reducing such activities where possible. Major progress has been made through both adopting technology and redesigning systems and equipment to reduce underwater diving. Increased use of Remote Operated Vehicles for cooling water system inspection and remote dredging equipment for cooling water system cleaning has helped to reduce both the hours and frequency of manned diving work required.
Another example was the recent introduction of Human and Organisational Performance pilot programmes in some business units, providing its people with core skills to support their teams in learning and driving performance improvement. A central component of this capability lift is the formation of operational Learning Teams who actively seek to understand and solve issues faced by those working on the frontline.
Read the 2020 case study on how robots help to eliminate diving risksSASB reference: IF-EU-320a.1; GRI reference: 403-4, 403-5, 403-6, 403-9, 403-10, EU17, EU18
There was an observable improvement in several key safety metrics when comparing the Group’s 2021 performance against 2020. This is summarised in the table below.
Regional safety performance (employees/contractors)
CLP Holdings | Hong Kong | Mainland China | Australia | India | Total | Employees and contractors combined | |
|---|---|---|---|---|---|---|---|
Fatalities (number) | 0/0 | 0/0 | 0/0 | 0/0 | 0/0 | 0/0 | 0 |
Fatality rate (number per 200,000 work hours) | 0.00/0.00 | 0.00/0.00 | 0.00/0.00 | 0.00/0.00 | 0.00/0.00 | 0.00/0.00 | 0.00 |
Days away from work injuries (number of personnel) | 0/0 | 0/4 | 0/0 | 4/5 | 0/1 | 4/10 | 14 |
Lost time injury rate (number per 200,000 work hours) | 0.00/0.00 | 0.00/0.07 | 0.00/0.00 | 0.18/0.40 | 0.00/0.03 | 0.05/0.08 | 0.07 |
High-consequence injuries (number of personnel) | 0/0 | 0/0 | 0/0 | 0/0 | 0/1 | 0/1 | 1 |
Total recordable injury rate (number per 200,000 work hours) | 0.13/0.22 | 0.02/0.14 | 0.00/0.08 | 0.45/0.97 | 0.00/0.41 | 0.14/0.29 | 0.23 |
Work-related ill health (number of personnel) – employees only | 0 | 0 | 0 | 1 | 0 | 1 | 1 |
Lost days (number) – employees only | 0 | 0 | 19 | 285 | 0 | 304 | 304 |
Lost time injury rate and total recordable injury rate of CLP Group (employees and contractors combined)
Download data (excel)Both lost time injury rate and total recordable injury rate have improved in 2021.
Lost time injury rate (LTIR) by region (employees and contractors combined)
Download data (excel)LTIR improved in all regions in 2021, except in Australia, which had an increase in LTIR due to a substantial decrease in hours worked.
- Starting from 2019, CLPe Solutions is reported under CLP Holdings to align with a change in internal reporting. Before that, it was reported under Hong Kong.
Total recordable injury rate (TRIR) by region (employees and contractors combined)
Download data (excel)TRIR improved in all regions in 2021, except in Australia & CLP Holdings, which noted increases in TRIR due to higher incident numbers (3 in Australia and 2 in CLPH) and decreases in total hours worked.
- Starting from 2019, CLPe Solutions is reported under CLP Holdings to align with a change in internal reporting. Before that, it was reported under Hong Kong.
Improving HSE management
During 2021, CLP businesses implemented the necessary changes set out by the 2021 HSE Improvement Strategy. The HSE Improvement Plan was assessed and refreshed for the next three-year period (2022-24), with an emphasis on becoming a learning organisation. The five pillars of the HSE Improvement Strategy remain critical to its continuity and ongoing approach. They address the emerging needs of the business moving forward.
This year's health and safety activities against each pillar are summarised below. Information on the environmental sustainability pillar is included in the Environment section.
Uplifting the Safety Culture
Rethinking Risk
- Safety in Design (SiD) training, developed specifically for CLP operations and project lifecycles, commenced across the Group. Expert external facilitators upskilled selected CLP personnel with foundational best practice knowledge, in a context that supports the business. Australia's first net-zero emissions hydrogen and gas capable power plant project, Tallawarra B, was contracted and designed under SiD principles. Additionally, a series of design review workshops for megaprojects in Hong Kong utilised SiD principles.
- A bowtie risk assessment is a risk evaluation method used to demonstrate causal relationships for high-risk scenarios in a visual way, clearly articulating plausible accident scenarios that could exist. A significant number of bowtie risk assessments were conducted across the regions.
Involving Stakeholders
- Involving stakeholders is a top priority of CLP’s multi-disciplinary team. Many contributors make or influence decisions that have the potential to impact workers’ safety. It is important that the interests of stakeholders are understood, and proper consultation and engagement processes are established to ensure their interests are consistent with the highest standards of safety. Work will continue to focus on establishing Human & Organisational Performance capabilities within CLP, allowing clearer visibility on work performed while leveraging frontline knowledge to find solutions.
- In Hong Kong, the team conducted a series of Safety Alignment Workshops for new contracts to align safety values and solicit safety leadership commitment from contractor partners.
- EnergyAustralia formalised an in house and online ergonomics tool called ‘Swivel’. It is specifically designed to ensure workstations (office and home-based) are ergonomically sound. In 2021, over 1,700 Swivel assessments were completed.
Maintaining a Healthy and Engaged Workforce
- 2021 continued to be challenging with the ongoing COVID-19 pandemic across the globe. Employee health and wellness was promoted through flexible working arrangements, equipment setups for remote working, regular communications, as well as health and wellbeing initiatives targeting mental and physical health awareness. Each region responded comprehensively in supporting their employees, particularly in respect to mental health and ergonomics. As such the internal CEO HSE Awards recognised all regions as winners for their committed and ongoing approach to employee health and well-being.
- This year, CLP launched its new online Health and Wellness portal, Virgin Pulse. The portal provides additional capacity to deliver targeted work-related health programmes and support other wellbeing efforts. By using the portal, employees can choose the personal wellness journey that suits them, engage with their fellow colleagues in a series of challenges and evaluate their own health risk factors.
- The Employee Assistance Programme in Mainland China supported staff and their families through multiple channels including a consultation hotline, monthly health newsletters and quarterly thematic workshops.
- At EnergyAustralia, the Employee Assistance Programme had very strong utilisation rates (>12% when annualised, above the industry average) in 2021. Virgin Pulse was also launched in Australia. To assist with the challenges of working from home with children, EnergyAustralia hosted online sessions for children and parents. These have included themes such as story time, clowns, magicians, comedians and how to get the most from home schooling. Focus on the health and wellbeing of employees continued through the EnergyAustralia “Spark” programme.
Find out how CLP supports its people during the COVID-19 pandemic from the Human Capital section in the 2021 Annual Report.
Safety around CLP’s network
Copy linkCopied link
GRI reference: 416-1, 416-2
While the Group’s HSE Management System Standard sets out an overarching approach to managing the safety risks in operations, responsibility is also taken for preserving public health and safety, including for people who work or live in close proximity to electricity supply lines.
CLP operates a transmission and distribution network in Hong Kong, as well as transmission networks in Shenzhen, China and Madhya Pradesh, India. Working near electricity supply lines can pose safety concerns. The Hong Kong and Mainland China operations conduct regular construction site inspections and provide cable plans and safety talks to road work contractors and site management personnel to enhance safety awareness at all locations.
EMF arising from power systems can be of public health concerns. CLP’s power supply equipment fully complies with the guidelines issued by the International Commission on Non-Ionizing Radiation Protection. Regular EMF measurements of power supply equipment are carried out jointly with the Electrical and Mechanical Services Department of the Hong Kong Government. The measured EMF levels continue to be well below the guideline limits.
Regarding customer health and safety, CLP Power has customer service centres conveniently located in its supply areas in Hong Kong to provide assistance on product safety, as well as advise on energy efficient products, energy saving tips and other account management issues. In 2021, there were no reportable cases of CLP products affecting customer health and safety in Hong Kong.
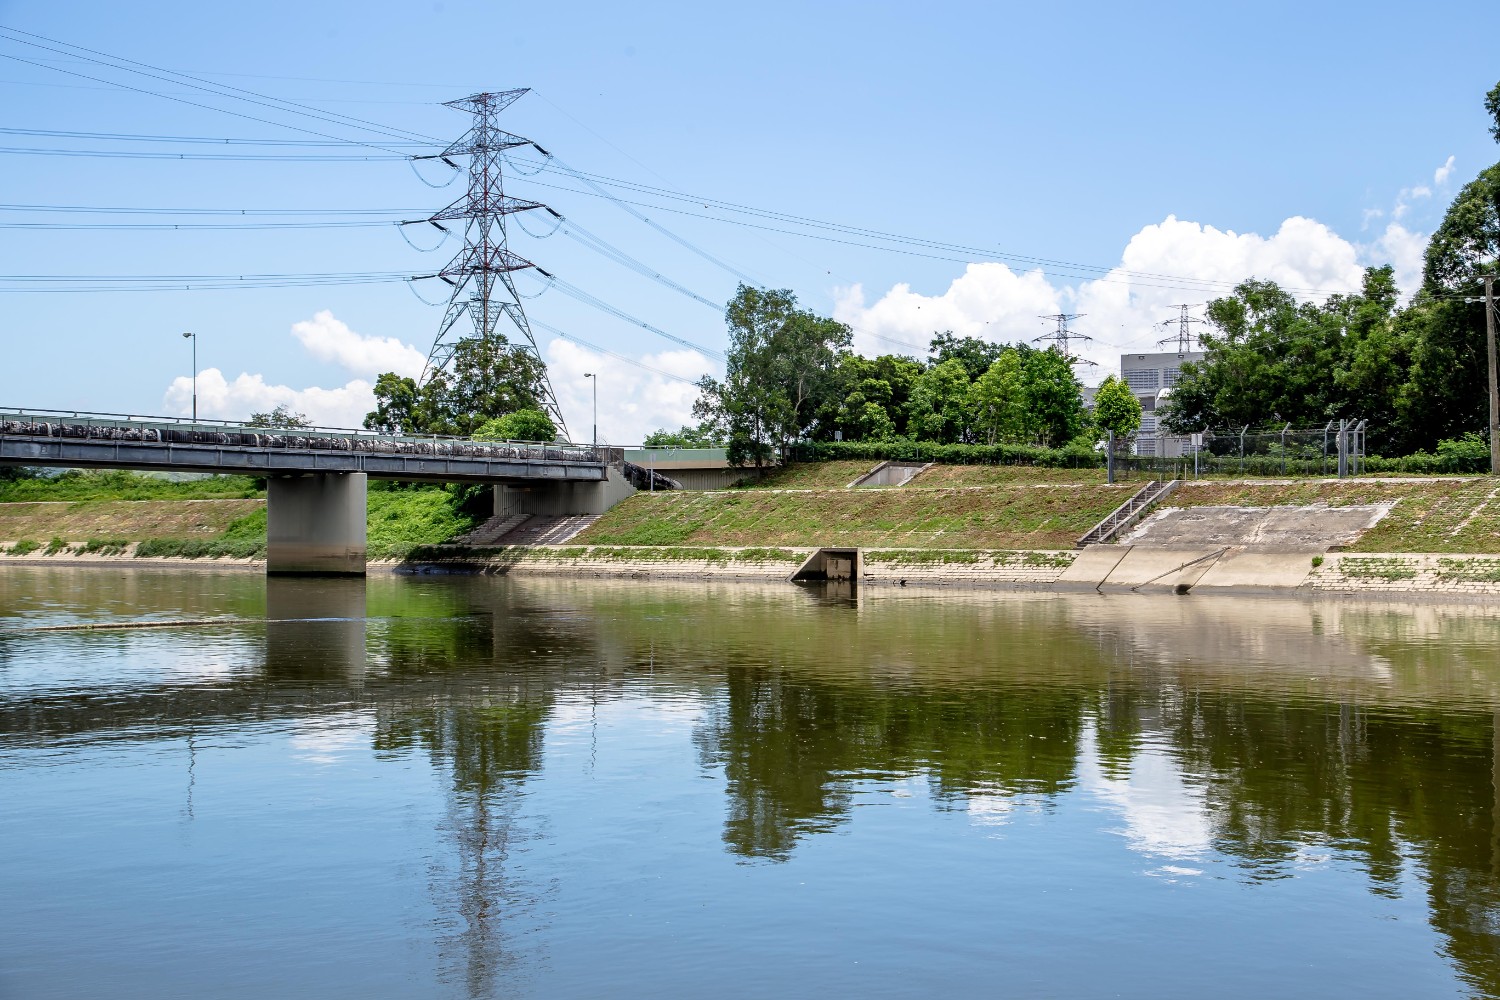
Maintaining proper Health, Safety and Environment management practices for transmission towers is important to keep the general public safe.
Nuclear safety
Copy linkCopied link
SASB reference: IF-EU-540a.2
Since 1985, CLP has held a 25% equity share in the Guangdong Daya Bay Nuclear Power Station (GNPS), which provides roughly one third of the electricity supplied to CLP’s customers in Hong Kong. In 2017, CLP’s nuclear portfolio was expanded with a 17% equity investment in Yangjiang Nuclear Power Co. Ltd. which operates Yangjiang Nuclear Power Station (YNPS) in Guangdong. Nuclear power has proven to be a reliable, cost-competitive and clean source of energy. To realise the Group’s decarbonisation vision, CLP continuously seeks investment opportunities for new capacity in low-carbon energies, such as nuclear power.
Nuclear risk management
The safe and steady operation of the two nuclear power stations remains a top priority. The defence-in-depth principle of safety is applied across the full spectrum of areas - from design, site selection, operation, radiation protection, environmental monitoring, to emergency preparedness. The safety principle of "As Low As Reasonably Achievable" (ALARA) is also applied to ensure robust radiation protection.
The two nuclear power stations have achieved good safety performance over the years. This achievement is a result of:
- Adopting best international practices, including the International Atomic Energy Agency Nuclear Safety Standards, in its operations;
- A well-trained and qualified workforce;
- Well-established safety practices and procedures; and
- Comprehensive risk analysis and mitigation.
Nuclear waste management
GNPS follows national policy and international practices for nuclear waste management. The station stores its spent nuclear fuel on-site in dedicated storage facilities.
The back-end management of the fuel cycle remains on site for a number of years before being passed on to a service provider licensed by the Mainland Chinese Government for reprocessing. The service provider is supervised by the National Nuclear Safety Administration (NNSA) and its environmental impact is monitored by the Ministry of Ecology and Environment (MEE). The policy in Mainland China on reprocessing spent nuclear fuel is similar to that of a number of European countries.
As the minority owner of GNPS, CLP is not in a position to report on the back-end management of the fuel cycle in China, including the status of the reprocessing plants for spent fuel.
Low- to intermediate-level solid radioactive waste is packed and stored in a dedicated facility on-site on an interim basis, and is secured to prevent unauthorised access. The waste is transferred to a final repository operated by a service provider, using the shallow burial method commonly adopted in the United States, France and the United Kingdom. The operation of the off-site repository is under the supervision of the national nuclear regulator and relevant nuclear safety regulations.
Monitoring and follow-up
Radiation exposure for workers is closely monitored and managed by plant operators both collectively and at an individual level as part of operating protocols. Workers incur most of their radiation dosage during planned refuelling outages, when much of the work is undertaken at the nuclear generating units. The level of radiation dosage is typically associated with the number of planned outages carried out at the units, which require inspection and maintenance activities in radiation-controlled areas.
Training and awareness
An on-site training school provides professional training on operational procedures for nuclear sites. The training aims to enhance nuclear safety and systematically minimise human error. There is a once-every-two-years requalification mechanism to ensure operator professionalism and competency in plant operation.
In line with good business practice, GNPS has also provisioned for the expenses associated with the future decommissioning of the plant as required by relevant laws and regulations.
GRI reference: 306-3 (2016), 306-1, 306-2, 306-3
The average dose rate in 2021 was less than 0.4 mSv per person per year. For the purpose of comparison, the background radiation dose rate for Hong Kong is 2.4 mSv per person per year from the natural environment.
Collective radiation dosage for workers
Download data (excel)The collective radiation dosage for the year was 642 man-mSv, lower than the 2020 level of 676 man-mSv when there was also one planned refuelling outage.
The charts below show the amount of spent nuclear fuel and low- to intermediate-level radioactive nuclear waste from GNPS over recent years. The amounts of both types of waste are related to the number of planned refuelling outages in each year.
One planned refuelling outage was carried out in GNPS in 2021, the same as in 2020. The total quantity of spent nuclear fuel generated in 2021 was similar to that of 2020.
Spent nuclear fuel
Download data (excel)The amount of spent nuclear fuel in 2021 was at the expected level given the one planned refuelling outage.
Solid radioactive nuclear waste
Download data (excel)There was a significant decrease in low- to intermediate-level nuclear waste in 2021, as compared with 2020, due to enhanced management.