Health, Safety, Security and Environment management Copy linkCopied link
CLP is committed to ensuring that all activities and operations within its control result in zero harm for its employees, contractors, customers and the public. This covers construction of new projects, operations and decommissioning.
In May 2020, CLP rolled out a new integrated HSSE Policy. As a result, the Group is currently refreshing its HSSE Management System (HSSEMS).
View the HSSE Policy
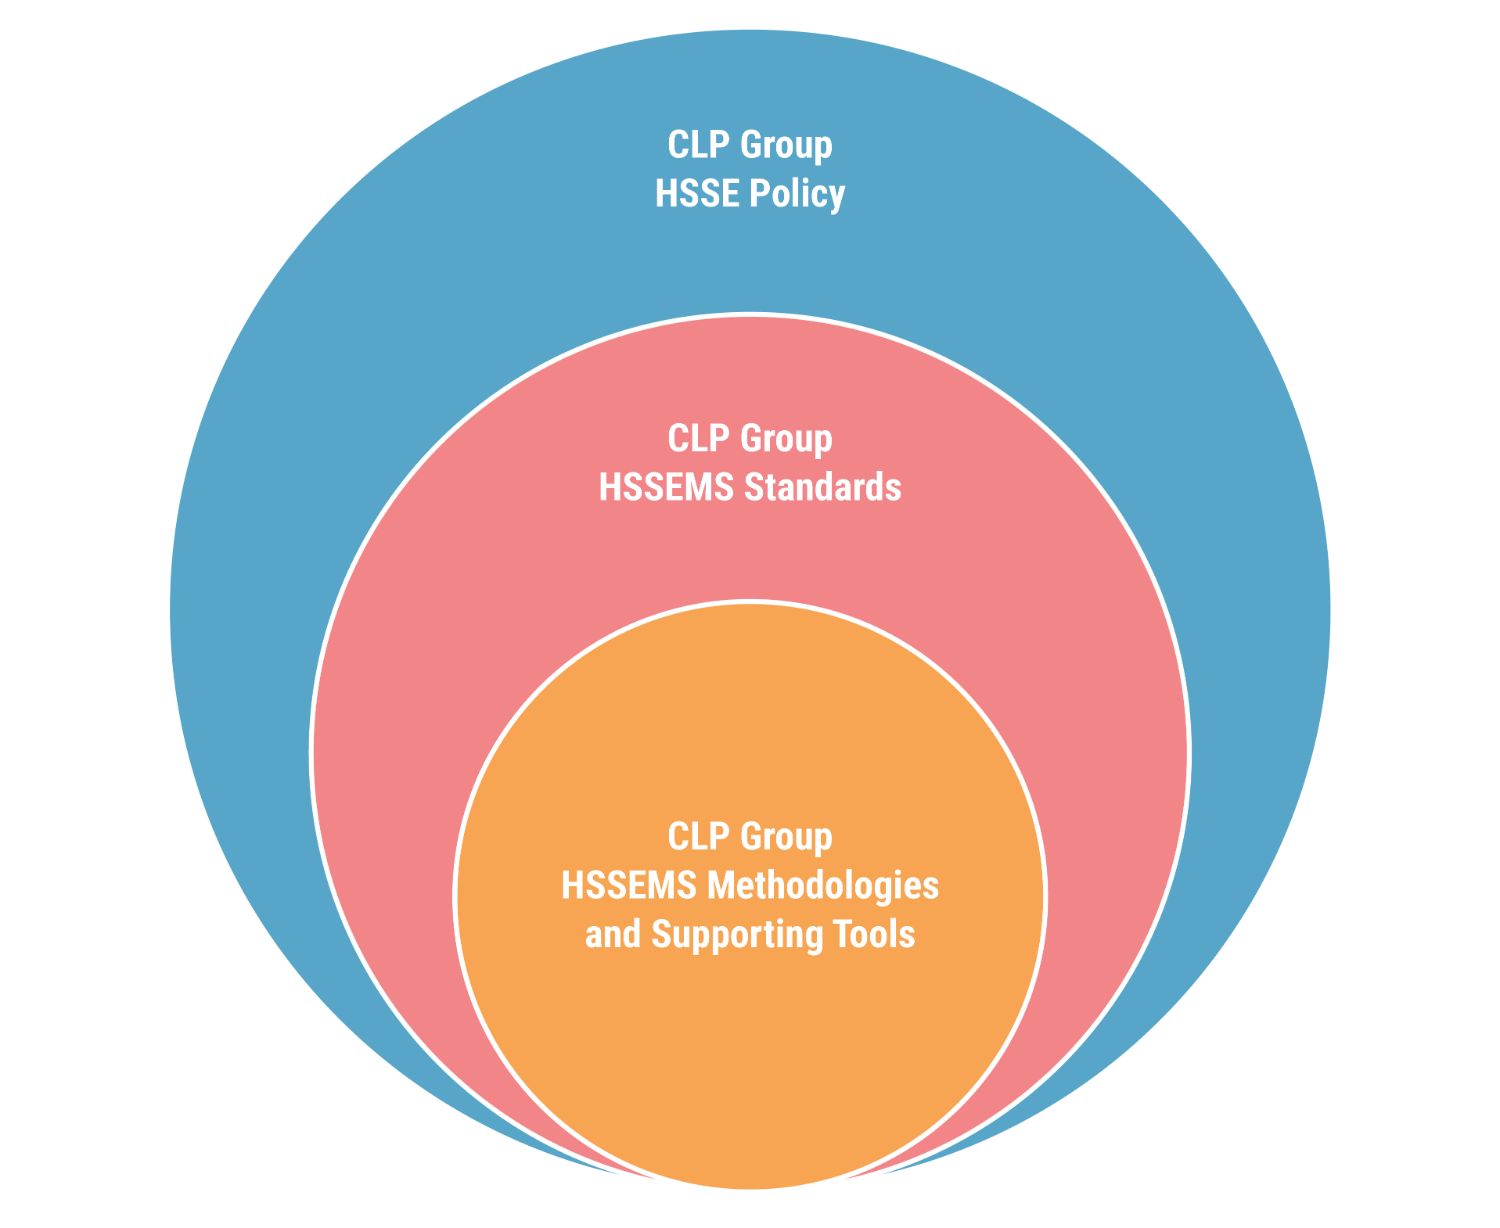
The Group’s HSSEMS assists in implementing CLP’s commitment to zero harm and the requirements of the new Group HSSE Policy. It is supported by a suite of standards with mandatory requirements, methodologies and other supporting tools. The diagram below shows the relationship and the core components of the HSSEMS.
HSSEMS core components and relationship
The refresh of the HSSEMS aims to:
Establish a risk-based HSSEMS to meet the objectives set out in the HSSE Policy
Further improve clarification of mandatory requirements within the CLP HSSEMS Standards
Enable the Group’s regional organisations to incorporate HSSEMS Standards into their business programme, and
Promote and encourage conformity to internationally accepted standards for occupational health and safety (ISO 45001) and environmental management (ISO 14001).
More details on how CLP manages Safety and Environment can be found in the relevant section of this report.
As the transition to the refreshed system is ongoing, certain parts of the refreshed HSSEMS are being developed under four sections:
Leadership and commitment
Planning and support
Operational enablers
Monitoring, learning and improving.
Goals and targets
To support safe operations, the Health, Safety and Environment Improvement Strategy (HSE Improvement Strategy) has clear objectives, programmes, timelines, and quantifiable key performance indicators (KPIs), as well as sufficient resources including HSSE professionals and an appropriate budget.
Read more about CLP's HSE Improvement StrategyOperational responsibilities
The Group HSSE Committee, chaired by the CEO, has the highest executive responsibility on HSSE-related issues. The Group Operations Leadership Team and the Global HSE Team conduct monthly meetings to coordinate, monitor and share knowledge and experience in HSSE practices across the Group. Special focus is given to achieving an overall higher level of safety performance.
In addition, various HSSE committees have been established to engage employees at the operational level. These committees also involve project partners and contractors. HSSE professionals facilitate the overall engagement effort and advise on HSSE matters, while the responsibility for implementing high levels of HSSE standards rests with line management.
Continuous improvement
An annual improvement programme is developed, approved and communicated to staff and contractors in each business unit. The programme follows the five pillars of the Group's HSE Improvement Strategy. Recommendations are implemented on agreed timescales and programme processes are monitored regularly.
Hierarchy of operational responsibilities

Asset management Copy linkCopied link
Strategies and procedures
CLP’s AMS Standard was developed in 2016 to standardise key practices in managing assets across the Group and ensure best practice. It accords with the ISO 55000 series of standards for asset management systems, as well as the ISO 31000 standards for risk management.
The AMS Standard is integrated into CLP’s Health, Safety, Security and Environment (HSSE) Management System and the Project Management Governance System (PMGS) Standards to manage the complete lifecycle of an asset.
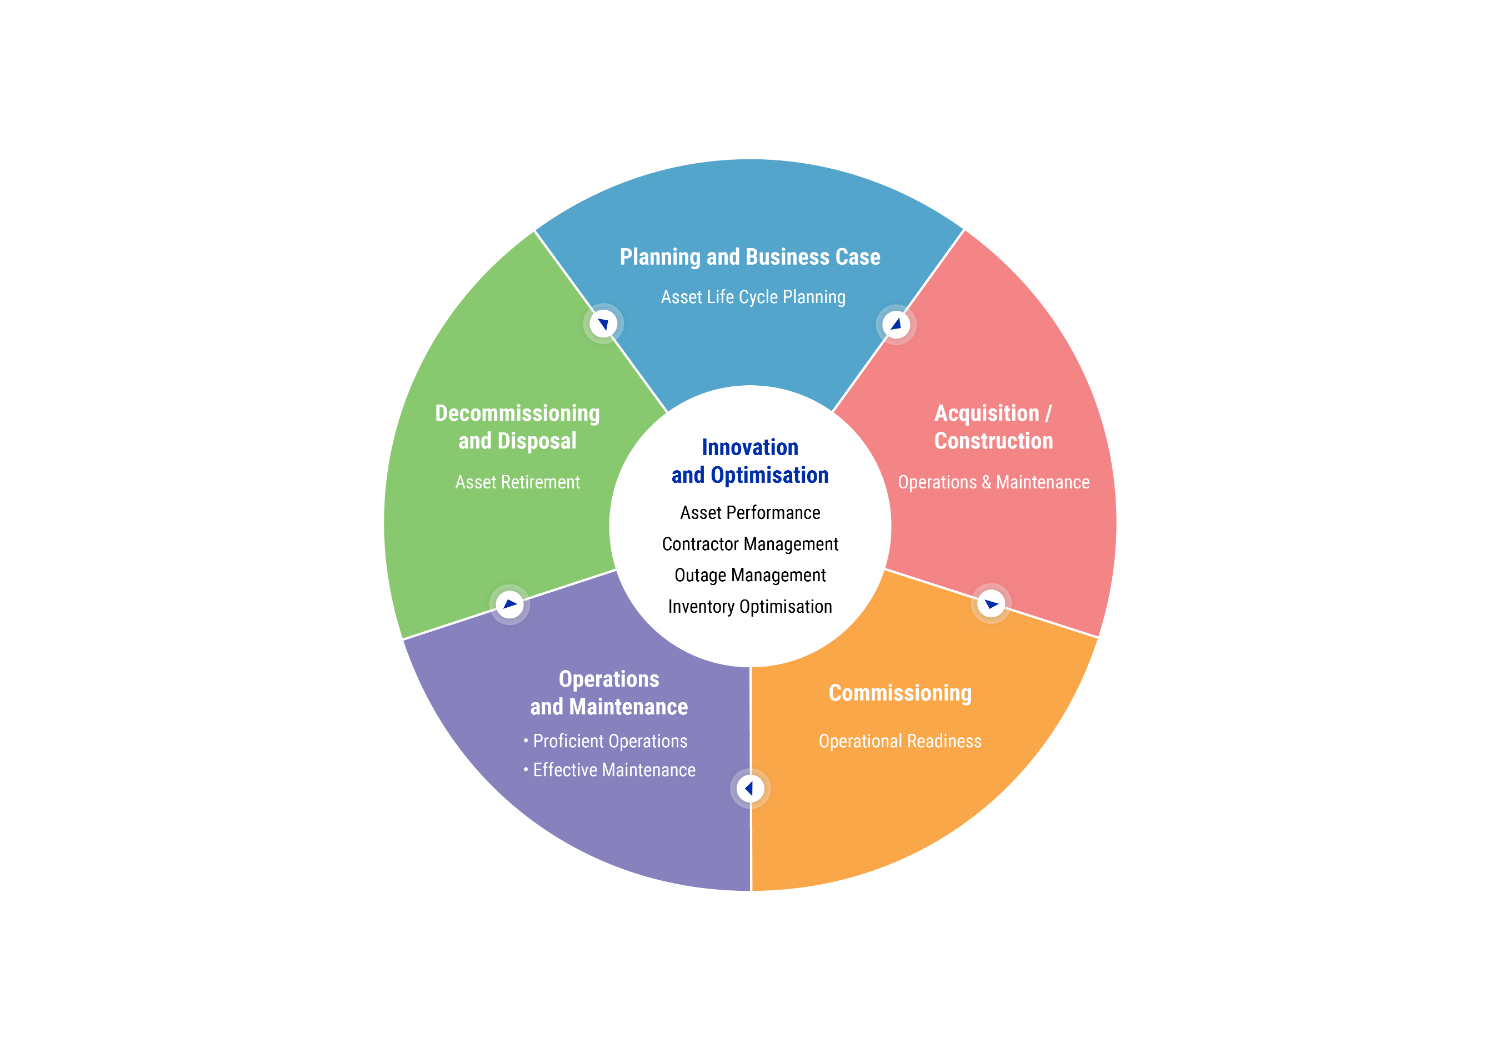
The AMS contains five key stages and 10 asset management elements, as illustrated in the diagram below.
Overview of the CLP asset management system
Monitoring and follow-up
CLP has developed and implemented an in-house non-financial data reporting and assurance standard. The customised Group Operations Information System (GOIS) is used to compile operational data. Its built-in data approval sequence and automated presentation and reporting functions strengthen data governance.
Relevant staff at the asset, regional and Group levels are expected to take responsibility for upholding the standard.
Continuous improvement
CLP constantly identifies opportunities to improve the operational efficiency of Group assets to help meet the increasingly stringent regulations on emissions and fuel efficiency in certain jurisdictions. There are also increasing improvement opportunities arising from innovation and optimisation, particularly from data analytics.
Initial efforts at the project planning stage are critical in determining the operational efficiency or capacity factor range of an asset through its entire lifespan. Projects involving a major asset overhaul require stringent technical and financial scrutiny before commencement.
Generation assets
Coal consumption was lowered in 2020 by 16.9%, compared to 2019. This was primarily due to a reduction in coal consumption at Castle Peak Power Station in Hong Kong, and higher utilisation of gas, a cleaner fuel, at Black Point Power Station. Gas consumption in 2020 was 25.7% higher mainly due to its increased utilisation at Black Point Power Station.
CLP reports the annual operating performance of its generation assets which fall within the reporting scope. The performance metrics include the availability factor, generation sent-out, thermal efficiency and energy intensity.
Download CLP’s asset performance statisticsCLP has been encouraging its asset managers to drive business innovation and explore operational potentials. One example is the recent innovation at Sihong Solar Power Station. Since February 2019, Jiangsu Sihong Solar Power Station, through its use of technology, configured its solar panels to achieve an 8% increase in performance ratio, resulting in an energy sales increase of 100MWh per year. This innovation was awarded a National Utility Model Patent by the National Intellectual Property Administration in August 2020.
Find out how innovation improves CLP Group's operational performanceFuel consumed for power generation
Download data (excel)Compared to 2019, there was a decrease in coal and oil consumption and an increase in gas consumption in 2020 as generation profiles changed.
Transmission network
To meet Hong Kong’s electricity demand growth, CLP reviews future transmission network developments annually in accordance with: the latest system maximum demand forecast; area load growth; infrastructure development; and generation development.
Maintenance and improvement programmes have been developed annually for major assets, based on the analysis of current conditions and performance of the assets, levels of investment and risk.
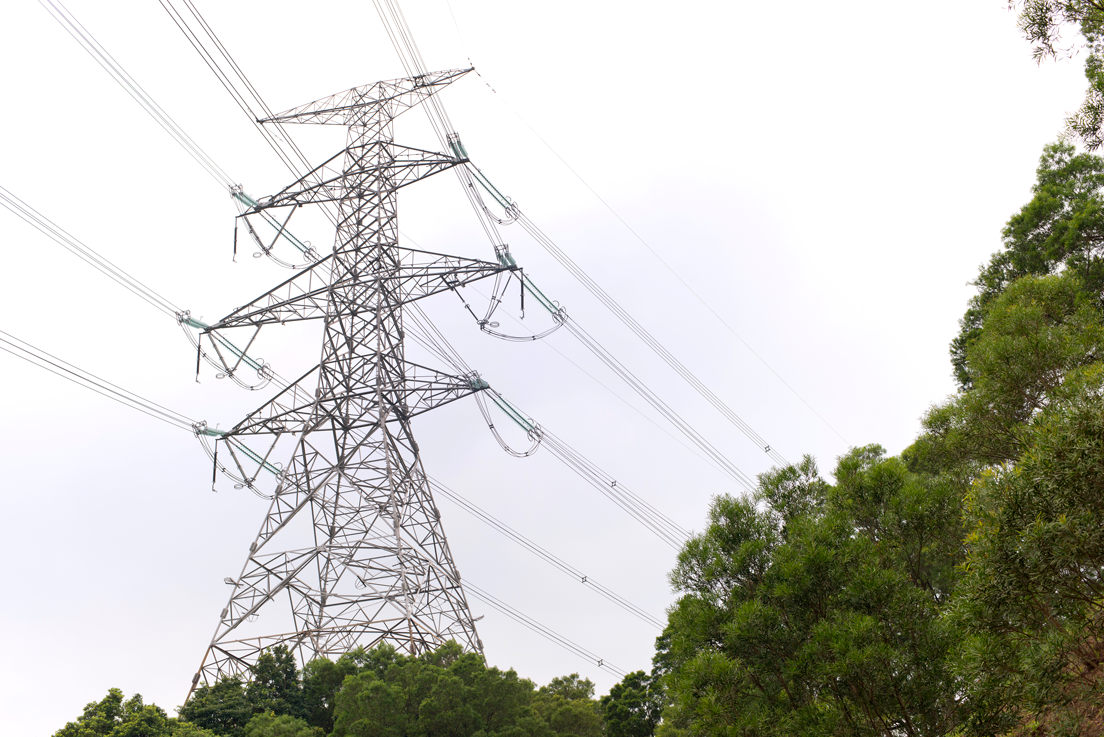
To ensure safe and reliable power supply, CLP safeguards the power systems with sophisticated equipment and best practices in operations.
CLP continues to improve the reliability of its power supply network. In addition to vegetation management and third-party damage prevention programmes, various other measures have been taken to further enhance network reliability and minimise customer supply interruption.
Examples include:
Installing online condition monitoring systems for switchgear and transformers to allow real-time monitoring and detection of incipient fault conditions
Continuing the reinforcement of transmission towers for 400kV overhead lines against super typhoons and the refurbishment of switchgear
Enhancing automatic detection and isolation of the faulty sections of overhead line circuits and expediting the deployment of smart meters in villages, and
Conducting regular reviews and targeted studies on network performance and climate risks to drive continual improvement.
For CLP India’s transmission assets acquired in 2019, predictive and corrective maintenance is the key philosophy adopted. This includes pre-emptive check-ups and assessments on operational clearances, ensuring assets are well structured and maintained with proper setup, hardware and security. Frequent patrolling was carried out for conducting assessments on landscape and assets. The results would be used to identify defects and plan for shutdowns if needed.
CLP India has begun using a mobile application for real-time tracking of site patrol to shorten the response time rectifications, if required. Thermo vision cameras aid the team in reaching the site with defects through heat mapping. The use of drones for site patrolling is under planning, while a ground team will be retained at strategic locations to allow them to attend to damages when required.
With the operations and maintenance strategy in place, CLP India was able to achieve 100% availability since its acquisition in November 2019.
CLP Power embraces innovation in green designs of assets, and integrates sustainable initiatives throughout the entire life cycle. Two CLP Power projects in Hong Kong attained the highest 'Provisional Platinum' rating in the BEAM Plus assessment in 2020.
BEAM Plus is Hong Kong’s leading initiative offering independent assessments of building sustainability performance. The assessment covers a wide range of sustainability issues relating to the planning, design, construction, commissioning, fitting out, management, operation and maintenance of a building. Two of CLP Power’s new built projects have attained the BEAM Plus 'Provisional Platinum' rating.
The Queen’s Hill 132kV Substation was commissioned and successfully energised in March 2020 to serve a new town development in the northeast New Territories of Hong Kong. The design of the substation takes the surrounding environment into consideration. It enhances energy efficiency and sustainability performance through the use of natural ventilation and light, eco-friendly building materials and green vegetation. Building Information Modelling (BIM) technology was also deployed during construction to enhance safety and overall cost effectiveness of the Substation.

The sustainable design of CLP Power’s Queen’s Hill 132kV substation won the Gold Award in the Transmission and Distribution Project of the Year category of the Asian Power Awards 2019.
The Black Point Power Station (BPPS) Additional Gas-Fired Generation Unit D1 is the newest expansion in the BPPS’s overall generation capacity and has an efficiency of around 60%, higher than that of other BPPS gas-fired units. In Unit D1, highly efficient irrigation technology and a rainwater collection system were installed to reduce freshwater consumption. In addition, over 140 pieces of photovoltaic panels were installed on the turbine hall roof to generate electricity. Together with adoption of energy efficient lighting fixtures, lifts and air-conditioning systems, the unit aims for energy efficient and environmentally-friendly operation.
Availability and reliability Copy linkCopied link
Goals and targets
Targets for each asset are set annually and included in the business plan. Performance is reported on a weekly basis to senior management. Any significant performance variance is analysed and corrective action is taken where appropriate.
For generation assets, CLP monitors the availability factor in terms of the amount of time that an asset is able to produce full load equivalent electricity over a certain period, divided by the amount of time in that period. Typical values range from 70% to 90%, and CLP aims to maintain an availability range of 90% and above for newer assets.
Strategies and procedures
While CLP has generation businesses across the Asia-Pacific region, Hong Kong is the only location where the business is vertically integrated, that is, it provides generation, transmission and distribution of power and retail. CLP Power Hong Kong is regulated by the Hong Kong Government under a Scheme of Control Agreement (SoC) framework that requires the Company to forecast electricity demand and plan for investment to provide a safe and reliable electricity supply to customers. In Hong Kong, CLP uses various measures to maintain high supply availability and reliability. These measures include:
Maintaining sufficient generating capacity to meet forecast demand as well as planned and unforeseen outages
Implementing demand-side management measures to reduce demand growth and to improve utilisation of existing assets
Upgrading generation and network facilities to meet new electricity demand
Adopting advanced technology such as smart grid
Improving the quality of the power supply to minimise voltage dips, and
Enhancing power systems to minimise the impact of adverse weather.
CLP promotes organisational learning and the building of technological capacities across the Group. Insights learned from regional experiences are shared amongst functions to plan for a consistent management framework. This practice facilitates better portfolio management and reduces risks to the Group’s operations as a whole.
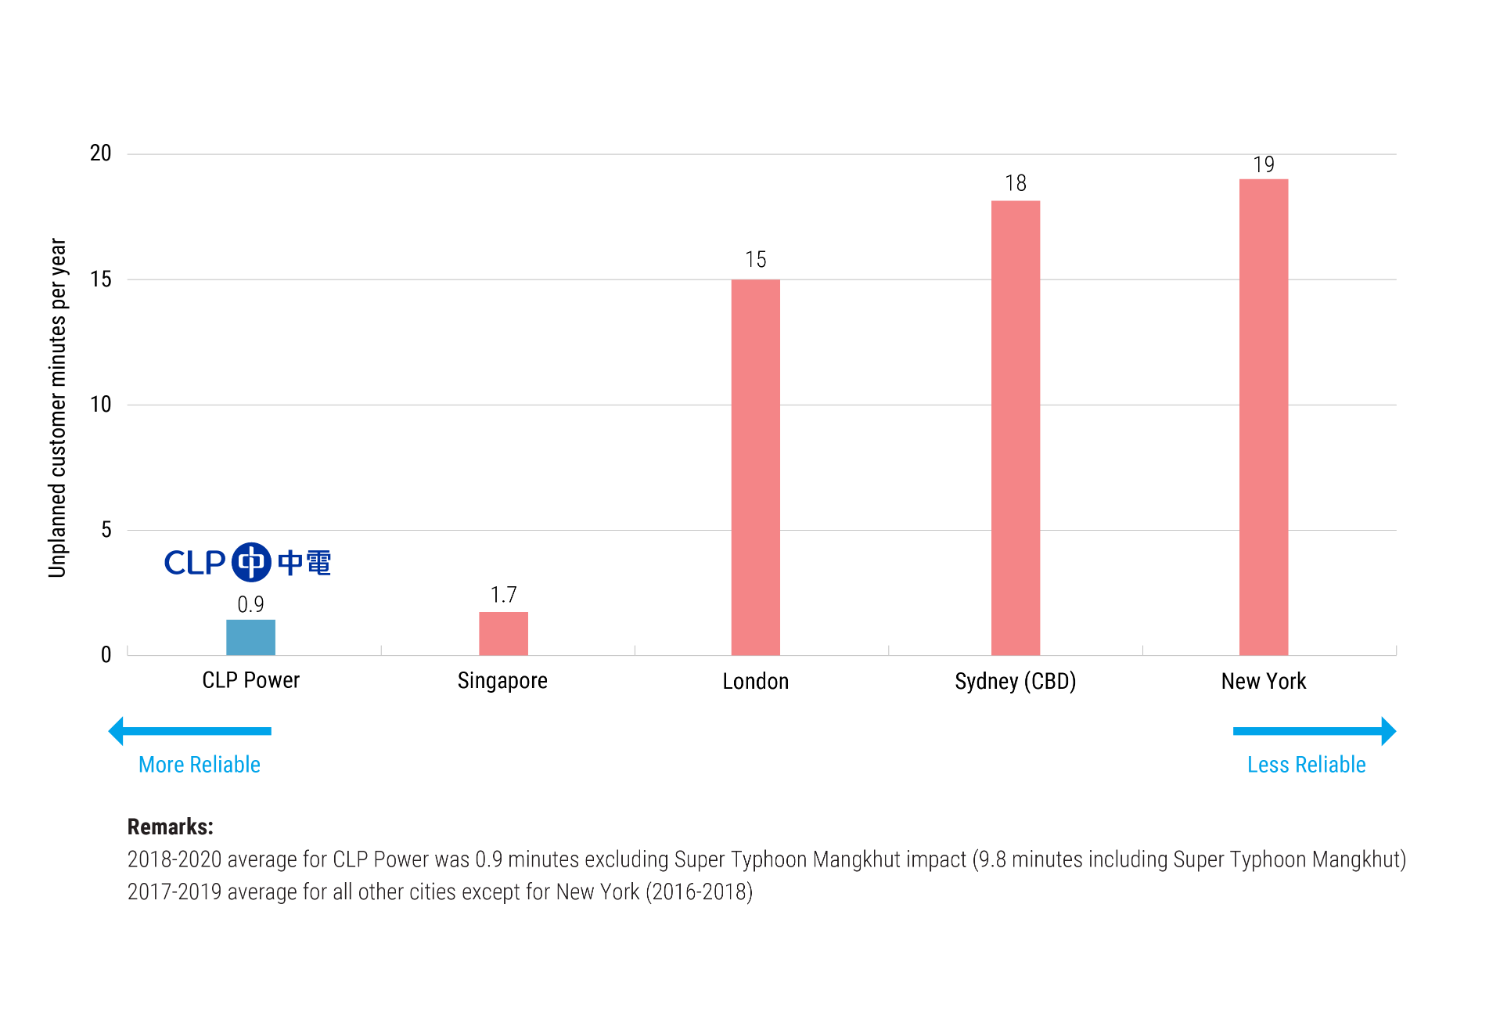
On a three-year rolling basis, from 2018 and 2020, a CLP Power Hong Kong customer experienced 9.77 minutes of unplanned power interruptions per year. The major interruption was due to the impact of Super Typhoon Mangkhut in September 2018. Excluding that interruption, the performance would have achieved a three-year rolling average of about 0.92 minutes. This achievement shows the value of a stable and supportive regulatory framework that encourages careful investment planning, as well as the professional expertise of CLP employees in power operations.
CLP’s transmission and distribution network in Hong Kong serves about 80% of the population of the city and close to 100% of the population in the Company’s service area. At the end of 2020, CLP Power had approximately 1,143km of overhead and approximately 15,103 km of underground circuits at medium or higher voltage. In addition, there were 235 primary and 15,028 secondary substations in Hong Kong. In 2020, the average network loss for the past five years was 3.69%, slightly lower than the five-year average of 3.83% reported in 2019.
A set of universally recognised supply reliability performance indicators is used from the Institute of Electrical and Electronics Engineers standard (IEEE 1366-2012) to monitor system performance. These indicators are reported annually to the Hong Kong Government.
In 2020, CLP continued to enhance the reliability and security of the supply system. It invested around HK$8.9 billion to meet both current and future energy demand.
Supply reliability performance indicators and results for CLP Power Hong Kong
Indicator | Result |
|---|---|
System Average Interruption Frequency Index (SAIFI) The average number of supply interruptions for each customer served. Both planned and unplanned interruptions are included. |
|
System Average Interruption Duration Index (SAIDI) The average duration of interruptions each customer may encounter in a given year. |
|
Unplanned Customer Minutes Lost (Unplanned CML) The average duration of unplanned power interruptions per customer in a given year. These outages occur without prior notice, and happen as a result of various factors such as weather events, third-party damage to the network and equipment faults. |
|
Security and cyber security Copy linkCopied link
Strategies and procedures
CLP’s approach to security can be best understood using the diagram below.
CLP's approach to security
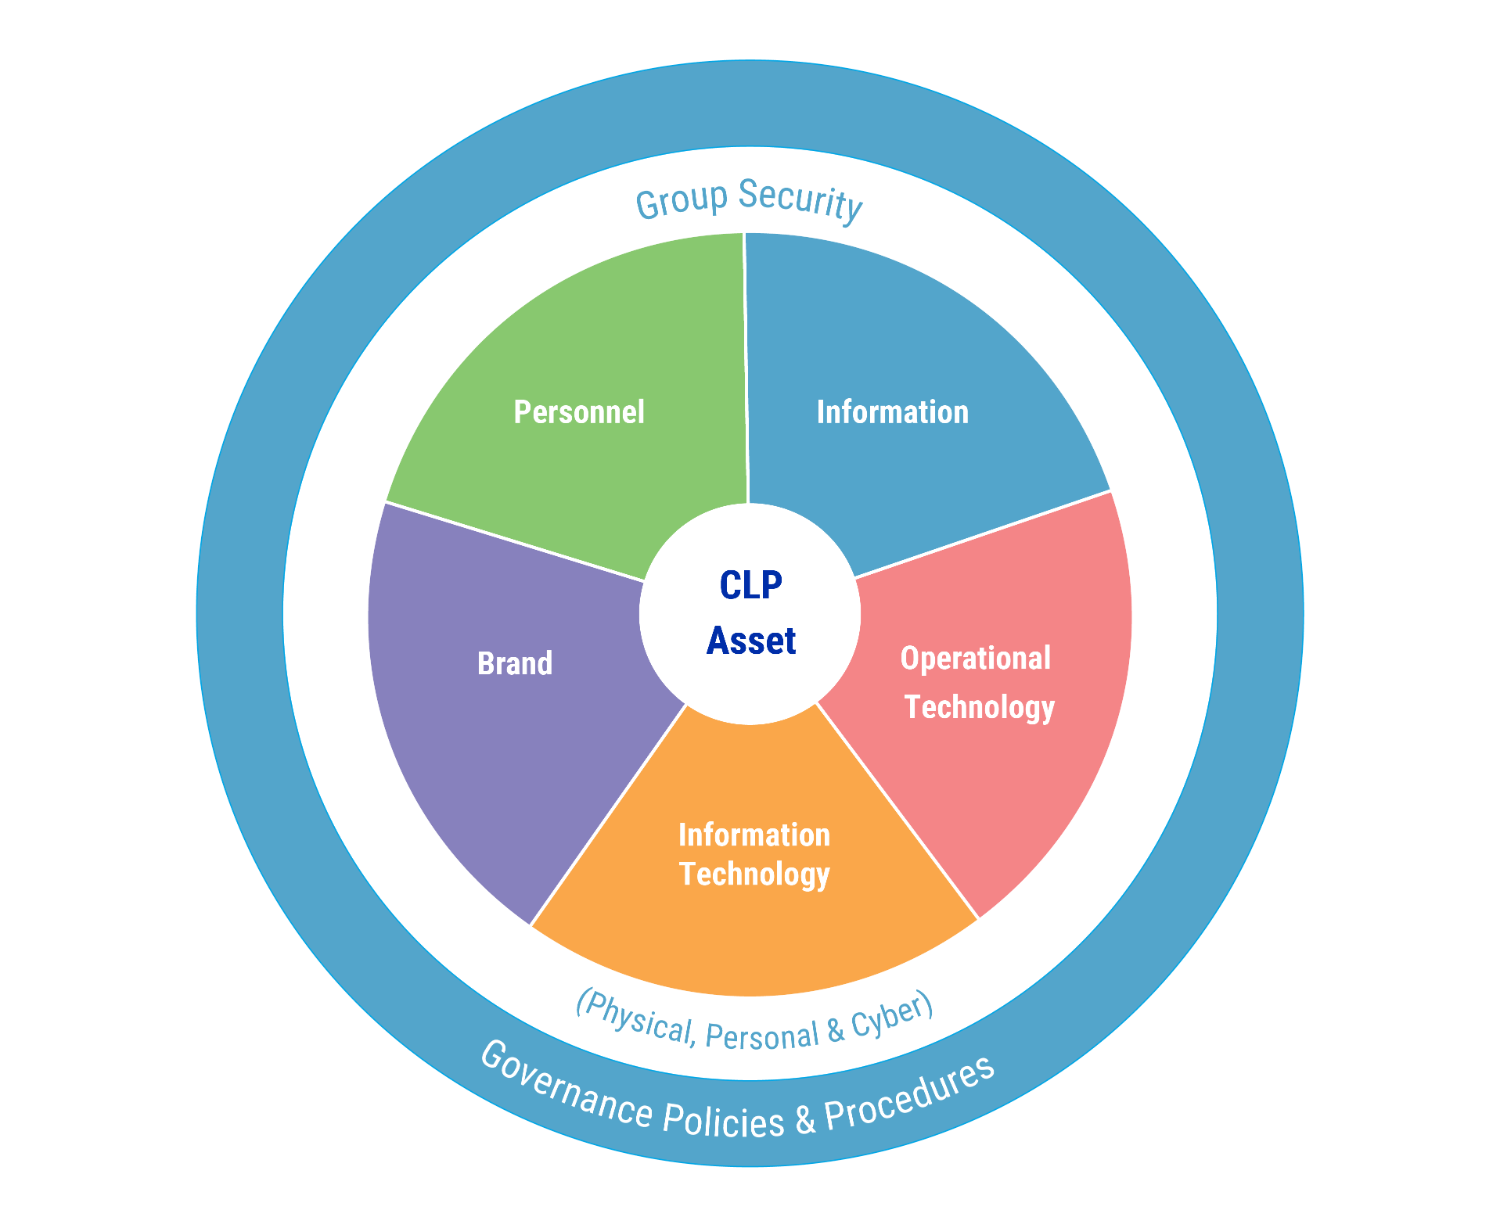
There are five separate but co-dependent lines of activity, all of which are protected (to a lesser or greater extent) by cyber and physical security measures. These lines of activity are:
Information: Data is stored in both hard and electronic formats. The confidentiality, integrity and availability of this data needs to be protected
Operational Technology (OT): Hardware and software that detects, monitors or controls physical devices (such as a turbine) at CLP assets, need to be protected
Information Technology (IT): The IT used to store, retrieve, transmit, and manipulate data or information needs to be protected
Personnel: Staff employed by CLP, both at the workplace and travelling for business, must be safe, and
Brand: CLP’s image, identity and associated reputation needs to be protected.
CLP security measures are robust and scalable. Taken together, they provide comprehensive, layered and flexible protection.
With reference to ISO/IEC27002:2013 Information Technology Security Techniques - Code of practice for information security controls, a set of Group-level policies have been developed. Regional standards and procedures have been developed from these policies, and tailored to suit the context and local regulation of the business unit.
Operational responsibilities
CLP Group Security was established in the first quarter of 2020, aiming to deliver a holistic security service to the Company by offering an in-house capability across the full range of security skillsets. Drawing on internal security professionals and recruiting from wider industry, the Group Security function is separate from both the IT and the Health & Safety departments. It is led by the Senior Director – Group Security, who is a highly experienced cyber security leader, and this role reports directly to the Group Chief Operating Officer.
The Group Security team’s responsibilities are discussed in the Reinforcing cyber resilience and data protection section of this Report.
Training and awareness
CLP security staff have a key role in preventing harm to staff and the wider public. Standards of conduct are informed by the newly revised CLP Value Framework and Security Management System, which requires each CLP region and site to develop an appropriate security system to effectively address the threats faced.
See how CLP builds internal capacity on cyber securityAll in-house security staff are required to comply with CLP’s Code of Conduct at all times, and receive Code of Conduct training on an annual basis. In addition to training on national regulations and site-specific requirements, third-party vendor security staff receive induction training on CLP’s policies on: ensuring a harassment-free workplace; minimum wage guidelines; and measures preventing discrimination in the workplace. This induction training must be completed before personnel are granted access to their assigned workplace sites.
Emergency and crisis management Copy linkCopied link
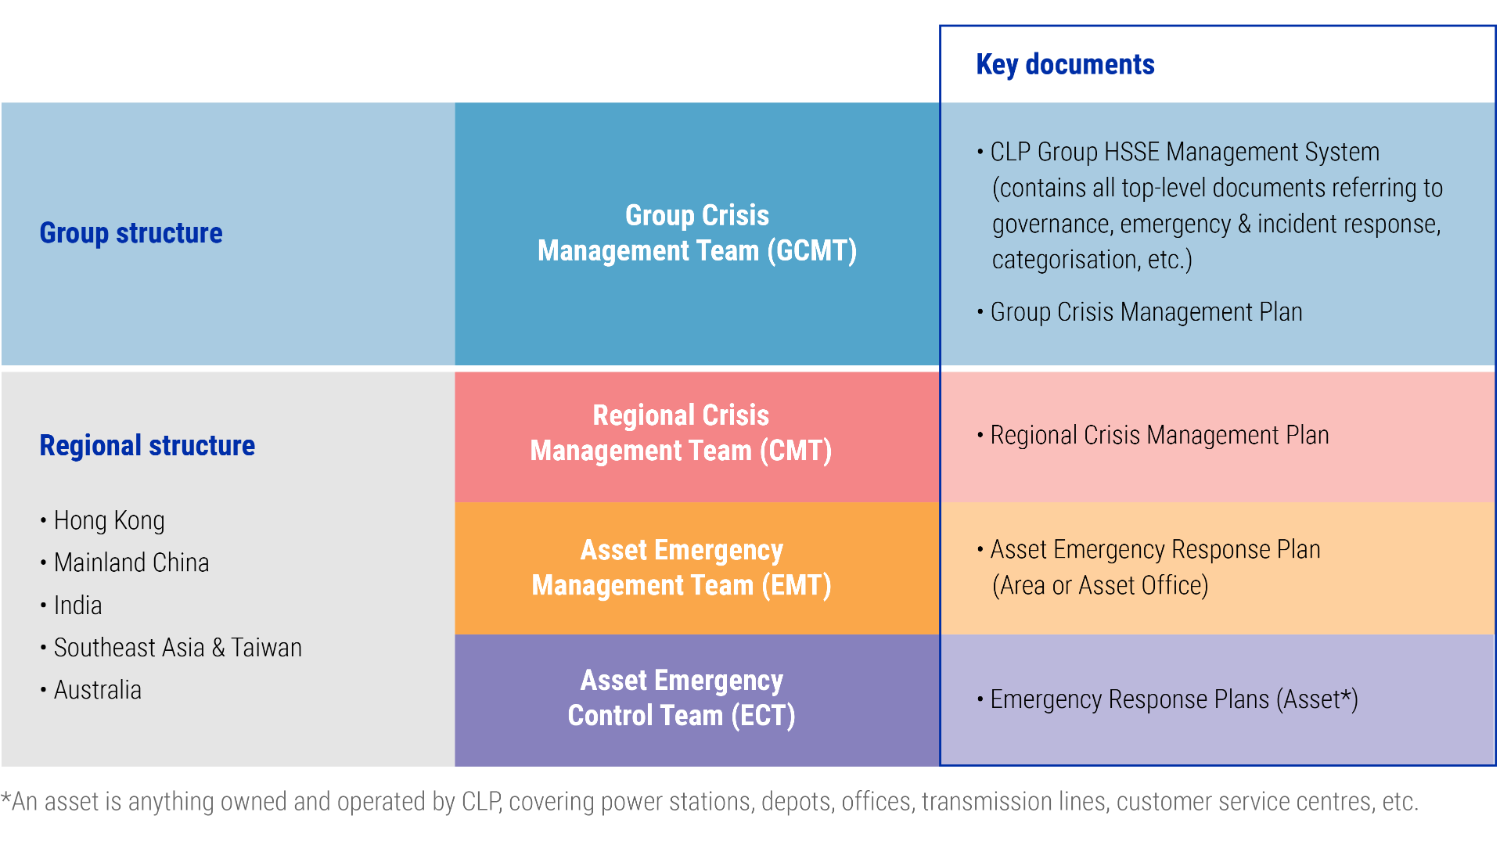
CLP’s Crisis Management & Emergency Response Structure is outlined in the diagram below. The Group Crisis Management Plan provides a platform for the effective handling of a crisis at the Group level. The plan:
Outlines crisis management organisation, roles, responsibilities, procedures and processes
Specifies the tools needed to ensure the collective response is well planned, well executed, and fully integrated across the organisation
Describes the relationship and interface between the handling of regional- and Group-level crises, and
Details the processes that govern internal and external communications during emergencies and crises; ensuring the people responsible for managing a crisis have the necessary information to carry out their responsibilities and that key stakeholders are informed.
The Group-level plan is supported at regional level by Regional Crisis Management Plans which mirror the Group document but are tailored for each region. In addition, detailed emergency response plans have been developed for each asset. These plans are designed to be used by first responders and asset managers.
CLP Crisis Management & Emergency Response Structure
Training and awareness
As specified in both Group and regional publications, emergency response drills are conducted at least annually at all Group sites, with smaller scale drills taking place more often. Group and Regional Crisis Management Plans are reviewed at least every three years. Regional crisis management exercises are conducted annually as part of the internal peer review process.
Travel security
Protocols and procedures are in place to adequately prepare staff before travel, support them when they are on the road, and respond quickly in the event of a travel emergency anywhere in the world. For emerging risks, information packs are updated regularly to help employees prepare for business trips.
In 2020, CLP upgraded its:
Everbridge Mass Notification system, a comprehensive notification system enabling users to send notifications to individuals or groups using lists, locations and visual intelligence
Secure chat Emergency Communications & Response (ECR) system, allowing secure two-way messaging
Crisis Communications Billboard (CCB), and
Audio and video systems installed in the key conference rooms in selected Company offices.
At the Group level, communications and administrative drills have been conducted quarterly to ensure that the equipment and procedures are functional and fully understood by the operators.
Over the course of 2020, business travel all but stopped in response to the COVID-19 pandemic. Instead, more effort was spent keeping staff across the Group informed on the travel situation and border closures across CLP's portfolio countries and other key destinations, as well as providing bespoke advice to those who needed it.
The protest situation in Hong Kong has all but died down, constituting a much lower threat profile to the business than it did 12 months ago. CLP will continue to monitor potential areas of concern.
Asset management
Fuel use | 2020 | 2019 | 2018 | 2017 | 2016 |
|---|---|---|---|---|---|
Coal consumed (for power generation) (TJ)1 | 403,379 | 485,453 | 521,568 | 471,976 | 453,904 |
Gas consumed (for power generation) (TJ)1 | 134,776 | 107,183 | 83,364 | 91,426 | 86,787 |
Oil consumed (for power generation) (TJ)1 | 2,243 | 2,620 | 3,807 | 5,069 | 4,162 |
- Numbers include operating assets where CLP has operational control during the calendar year. Paguthan Power Station, the power purchase agreements of which expired in December 2018, was not included in the 2019 and 2020 numbers.
Generation and energy storage capacity | 2020 | 2019 | 2018 | 2017 | 2016 |
|---|---|---|---|---|---|
On an equity basis | |||||
Total generation and energy storage capacity by asset type (% (MW))1,2 | 100 (19,691) | 100 (19,238) | 100 (19,108) | 100 (19,395) | 100 (18,622) |
Coal | 54.7 (10,765) | 56.0 (10,765) | 56.3 (10,765) | 58.8 (11,401) | 61.2 (11,396) |
Gas | 23.4 (4,600) | 21.8 (4,194) | 21.7 (4,147) | 17.7 (3,434) | 18.4 (3,434) |
Nuclear | 8.1 (1,600) | 8.3 (1,600) | 8.4 (1,600) | 8.2 (1,600) | 2.6 (492) |
Renewables | 12.8 (2,517) | 12.8 (2,469) | 12.5 (2,386) | 14.2 (2,751) | 16.6 (3,090) |
Energy Storage | 0.0 (0) | N/A | N/A | N/A | N/A |
Others | 1.1 (210) | 1.1 (210) | 1.1 (210) | 1.1 (210) | 1.1 (210) |
On an equity plus long-term capacity and energy purchase basis | |||||
Total generation and energy storage capacity by asset type (% (MW))1,2,3 | 100 (24,696) | 100 (24,015) | 100 (23,705) | 100 (24,554) | 100 (23,781) |
Coal | 48.6 (11,997) | 50.0 (11,997) | 50.6 (11,997) | 51.4 (12,633) | 53.1 (12,628) |
Gas | 23.2 (5,717) | 21.4 (5,139) | 21.4 (5,084) | 21.7 (5,322) | 22.4 (5,322) |
Nuclear | 10.9 (2,685) | 11.2 (2,685) | 11.3 (2,685) | 10.1 (2,488) | 5.8 (1,380) |
Renewables | 13.5 (3,342) | 13.7 (3,294) | 12.8 (3,039) | 13.1 (3,211) | 14.9 (3,551) |
Energy Storage | 2.7 (655) | N/A | N/A | N/A | N/A |
Others | 1.2 (300) | 3.7 (900) | 3.8 (900) | 3.7 (900) | 3.8 (900) |
- Numbers have been subject to rounding. Any discrepancies between the total shown and the sum of the amounts listed are due to rounding.
- Starting from 2020, a new "Energy Storage” asset category is added, under which pumped storage and battery storage are included. In previous years, assets under the “Others” category included oil-fired generation assets and pumped storage.
- Numbers include assets with majority and minority share, and those under "long-term capacity and energy purchase" arrangements with CLP. Starting from 2018, "long-term capacity and energy purchase" has been defined as a purchase agreement with duration of at least five years, and capacity or energy purchased being no less than 10MW.
Renewable generation capacity | 2020 | 2019 | 2018 | 2017 | 2016 |
|---|---|---|---|---|---|
On an equity basis | |||||
Total renewable generation capacity by asset type (MW)1 | 2,517 | 2,469 | 2,386 | 2,751 | 3,090 |
Wind | 1,521 | 1,521 | 1,521 | 1,941 | 2,297 |
Hydro | 489 | 489 | 489 | 489 | 489 |
Solar | 499 | 451 | 369 | 321 | 304 |
Other renewables | 7 | 7 | 7 | N/A | N/A |
On an equity plus long-term capacity and energy purchase basis | |||||
Total renewable generation capacity by asset type (MW)1,2 | 3,342 | 3,294 | 3,039 | 3,211 | 3,551 |
Wind | 2,049 | 2,049 | 1,982 | 2,401 | 2,758 |
Hydro | 489 | 489 | 489 | 489 | 489 |
Solar | 793 | 745 | 558 | 321 | 304 |
Other renewables | 10 | 10 | 10 | N/A | N/A |
- Numbers have been subject to rounding. Any discrepancies between the total shown and the sum of the amounts listed are due to rounding.
- Numbers include assets with majority and minority share, and those under "long-term capacity and energy purchase" arrangements with CLP. Starting from 2018, "long-term capacity and energy purchase" has been defined as a purchase agreement with duration of at least five years, and capacity or energy purchased being no less than 10MW.
Energy sent out | 2020 | 2019 | 2018 | 2017 | 2016 |
|---|---|---|---|---|---|
On an equity basis | |||||
Total energy sent out by asset type (% (GWh))1,2,3 | 100 (68,699) | 100 (70,949) | N/A | N/A | N/A |
Coal | 57.4 (39,438) | 62.9 (44,596) | N/A | N/A | N/A |
Gas | 18.0 (12,390) | 14.1 (9,979) | N/A | N/A | N/A |
Nuclear | 16.3 (11,192) | 15.3 (10,888) | N/A | N/A | N/A |
Renewables | 8.3 (5,678) | 7.7 (5,487) | N/A | N/A | N/A |
Energy Storage | 0.0 (0) | N/A | N/A | N/A | N/A |
Others | 0.0 (1) | 0 (0) | N/A | N/A | N/A |
On an equity plus long-term capacity and energy purchase basis | |||||
Total energy sent out by asset type (% (GWh))1,2,4,3,5 | 100 (85,937) | 100 (88,573) | 100 | 100 | 100 |
Coal | 47.8 (41,118) | 54.8 (48,512) | 60 | 61 | 63 |
Gas | 20.0 (17,157) | 14.8 (13,073) | 12 | 15 | 14 |
Nuclear | 23.2 (19,923) | 21.9 (19,400) | 20 | 15 | 14 |
Renewables | 9.1 (7,855) | 8.7 (7,699) | 8 | 9 | 9 |
Energy Storage | -0.1 (-118) | N/A | N/A | N/A | N/A |
Others | 0.0 (1) | -0.1 (-109) | 0 | 0 | 0 |
On an operational control basis | |||||
Total energy sent out (GWh)3 | 58,918 | N/A | N/A | N/A | N/A |
- Numbers and percentage figures have been subject to rounding. Any discrepancies between the total shown and the sum of the amounts listed are due to rounding.
- Starting from 2020, a new "Energy Storage” asset category has been added, under which pumped storage and battery storage are included. In previous years, assets under the “Others” category included oil-fired generation assets and pumped storage.
- Paguthan Power Station, the power purchase agreements of which expired in December 2018, was not included in the 2020 number.
- Numbers include assets with majority and minority share, and those under "long-term capacity and energy purchase" arrangements with CLP. Starting from 2018, "long-term capacity and energy purchase" is defined as a purchase agreement with duration of at least five years, and capacity or energy purchased being no less than 10MW.
- Only percentages are available for the years 2016-18.
Availability and reliability
CLP Power Hong Kong | 2020 | 2019 | 2018 | 2017 | 2016 |
|---|---|---|---|---|---|
System Average Interruption Frequency Index [SAIFI]1 | 0.19 | 0.17 | 0.19 | 0.18 | 0.18 |
System Average Interruption Duration Index [SAIDI] (hours)1 | 0.39 | 0.42 | 0.46 | 0.34 | 0.35 |
Unplanned Customer Minutes Lost [CML] (minutes)1 | 9.772 | 10.133 | 10.294 | 1.57 | 1.48 |
- The numbers are derived by calculating the average of data from the most recent three years. For example, the figures under year 2020 are the 3-year averages of data from 2018 to 2020.
- The 2018-2020 average would have been about 0.9 minutes without the severe impact of Mangkhut in September 2018.
- The 2017-2019 average would have been about 1.3 minutes without the severe impact of Mangkhut in September 2018.
- The 2016-2018 average would have been about 1.44 minutes without the severe impact of Mangkhut in September 2018.
2020 data shaded in orange have been independently verified by PricewaterhouseCoopers. The assurance scope of past years' data can be found in previous Sustainability Reports.


