All Hong Kong assets under CLP’s operational control maintained full compliance with environmental regulations in 2019.
CLP Power has concluded discussions with the Hong Kong Government on the new emissions cap starting in 2024. Under the Technical Memorandum, the allowances for air emissions of sulphur dioxide (SO2), nitrogen oxides (NOx) and respirable suspended particulates (RSP) will be reduced by 90%, 66% and 65% respectively compared to 2010 levels. The upgrade of all existing combined cycle gas turbine (CCGT) units and the development of two new additional CCGT units will ensure CLP is ready. CLP is also cognisant of the Government’s plan to tighten the Air Quality Objectives for which a public consultation was conducted in 2019.
Standard ESG Disclosures
Go to
About sustainability reporting
CLP continually improves by managing, monitoring and reporting its performance. These tables present a quantitative overview of the Group's 2019 financial and non-financial performance. The disclosures are selected from the GRI Standards, Hong Kong Stock Exchange ESG Reporting Guide and TCFD Electric Utilities Preparer Forum, as well as other key performance data.
2019 data shaded in orange have been independently verified by PricewaterhouseCoopers. The assurance scope of past years' data can be found in previous Sustainability Reports.
Corporate governance framework and code
Good corporate governance promotes and safeguards the interests of shareholders and other stakeholders. CLP is committed to maintaining a rigorous framework of corporate governance which upholds the Group’s credibility and reputation.
Corporate governance is a matter of culture, driving CLP to continually make conscious decisions around correct behaviours. The table summarises how CLP manages corporate governance through the CLP Code, the CLP Corporate Governance Framework and a comprehensive set of policies and guidelines:
How CLP Holdings approaches corporate governance
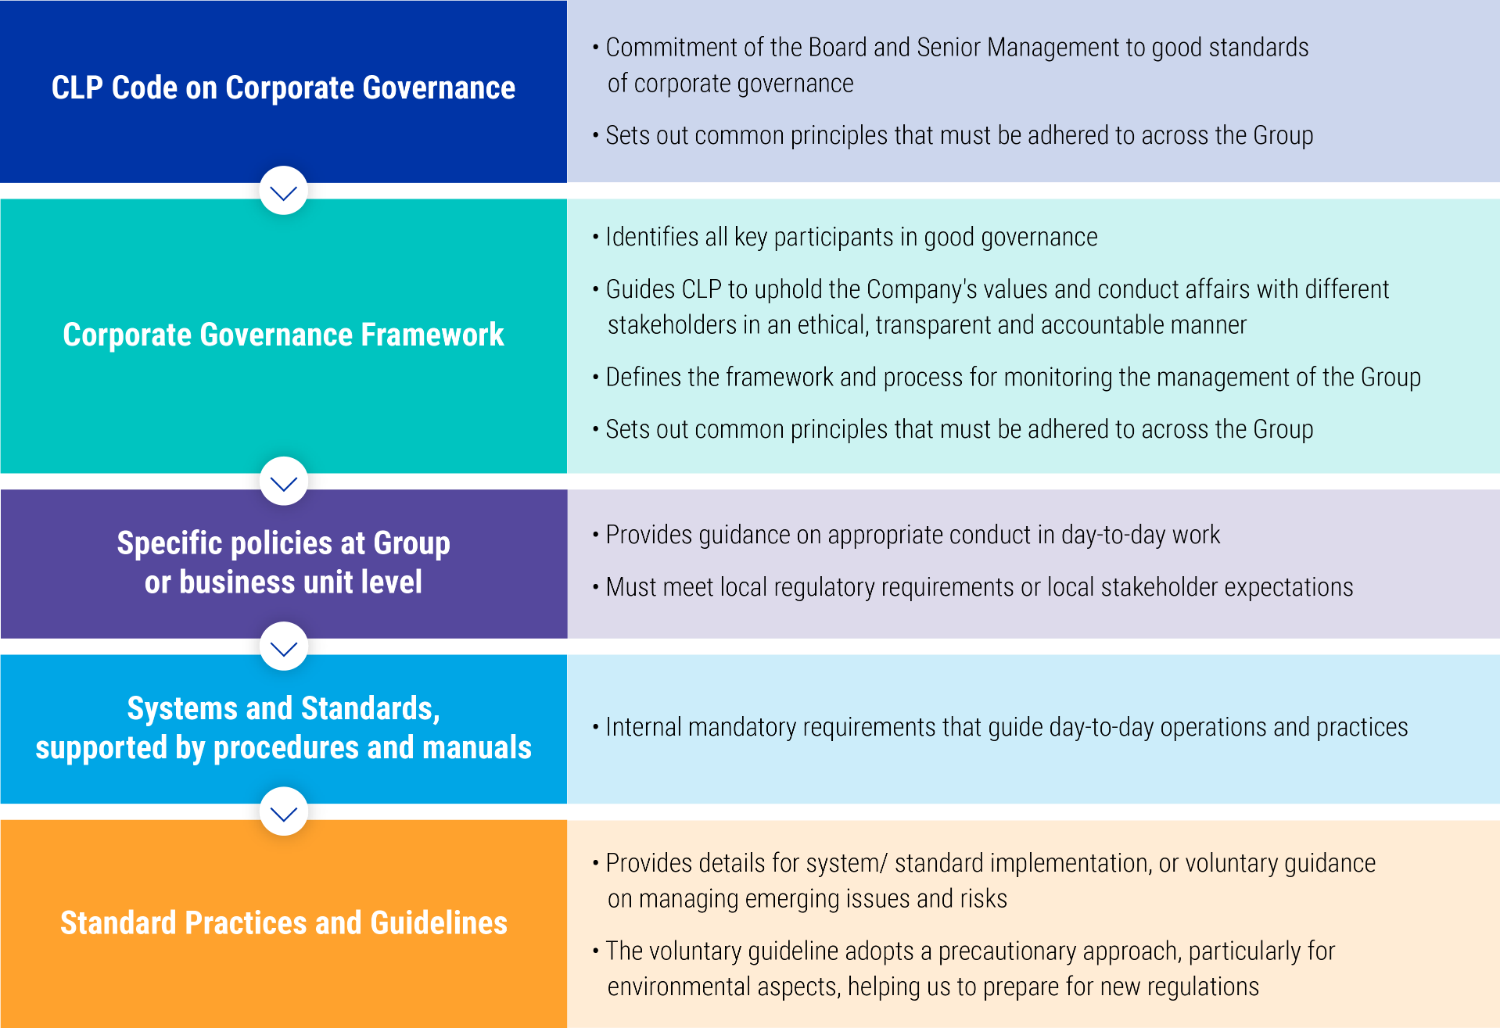
The CLP Code was updated in 2019 to reflect new requirements under the Rules Governing the Listing of Securities issued by The Stock Exchange of Hong Kong Limited and CLP's current corporate governance practices. While embracing the terms set out within the Hong Kong Stock Exchange’s Corporate Governance Code and Corporate Governance Report, the CLP Code seeks to go beyond this by advancing a structure that builds on CLP’s own standards and experience.
The Board is CLP’s highest governance body and actively promotes the success of the Group by directing and supervising all of its affairs in a responsible and effective manner. Some of these responsibilities are discharged through delegation to six Board Committees. The two committees most involved in sustainability-related matters are the Sustainability Committee and the Audit & Risk Committee.
Download the CLP Code on Corporate Governance Find out more about sustainability governanceThe Corporate Governance Report in the Annual Report discloses CLP’s governance performance in detail. Following the enhancement of the Board Diversity Policy in early-2019, the gradual refreshment of the Board is underway and this was also extended to the membership of the Board Committees.
CLP continues to take a forward-looking approach in enhancing its corporate governance practices. Recognising a number of signature strengths of the Board, the external Board Review undertaken in 2019 has also identified opportunities to further enhance the Board’s contribution to CLP's long-term strategic agenda.
Read the Corporate Governance Report in the 2019 Annual Report
The Human Resources and Remuneration Committee Report covers CLP's Remuneration Policy, including the non-financial metrics considered for executive’s remuneration.
Code of Conduct and anti-corruption
The Code of Conduct is available to the public and applies across the entirety of CLP Group – including CLP Holdings, its wholly owned subsidiaries, and joint ventures or companies in which CLP holds a controlling interest. All employees of CLP, irrespective of their position and function, are expected to fully adhere to the principles contained in the Code. In the case of joint ventures or companies in which CLP does not hold a controlling interest, the representatives are also expected to act in accordance with the Code and to make a concerted effort to influence those with whom they are working to follow similar standards of integrity and ethical behaviour. Likewise, contractors working for CLP are encouraged to follow the Code for the duration of their contract, and also encourage their subcontractors to do the same.
Download CLP's Code of Conduct
CLP's Whistleblowing Policy encourages employees and related third parties (such as customers and suppliers) who deal with CLP to raise concerns about any real or perceived misconduct, malpractice or irregularity through a confidential reporting channel.
Training and awareness
Training in relation to the Code of Conduct is mandatory for all staff after joining the Company. CLP promotes the Code of Conduct and Whistleblowing Policy to employees on a regular basis, by advising of any updates or revisions. Every four years, the Company conducts a Business Practice Review (BPR) process for all employees in person to refresh a company-wide understanding of the principles of the Code, and help to ensure business practices remain compliant. Any potential issues are raised and reviewed with management. A number of case studies based on past violations are also included to highlight how to properly handle potential and actual situations in which the Code has been violated. Contractors are encouraged to attend the BPR sessions alongside CLP employees.
Monitoring and follow-up
The General Representation Letter (GRL) process is one of the means by which non-compliance with the Code can be reported. The process reinforces personal responsibility for good governance and sets controls at all levels within CLP. For instance, business practices are reviewed and fraud risks in different areas assessed as part of the process, while irregularities or exceptions are reported for the attention of senior management. Managers in the Group are also required to sign the Code of Conduct Compliance Statement on an annual basis.
The CLP-wide reporting system for Code of Conduct violations applies to any alleged or potential breach. All CLP employees are expected to co-operate fully in the investigation of an alleged violation, and disciplinary action applies to any staff member found to be in breach of the Code. The number of breaches of the Code and any cases of corruption are reported annually, with the relevant data verified by a third party.
Operational responsibilities
Potential violations of the Code of Conduct are reported to the Group Internal Audit (GIA) by employees, vendors, contractors and GIA auditors. Communications are received through means such as anonymous letters, emails or phone calls.
GIA regularly reviews compliance with the Code, and investigates any potential violations, except for those related to human resources, which are investigated by Human Resources (HR).
Non-compliance with the Code results in disciplinary action. The Group Code of Conduct Committee, which comprises the Executive Director and Chief Financial Officer, Group General Counsel & Chief Administrative Officer, and Chief Human Resources Officer, reviews and endorses any disciplinary measures taken.
For a quicker response to Code of Conduct violations in Australia, EnergyAustralia has been delegated the responsibility to manage and take action for violations committed by EnegyAustralia employees. EnergyAustralia will inform the CLP Holdings Audit & Risk Committee of cases involving senior EnergyAustalia employees.
For CLP India, a separate Internal Complaints Committee was established to handle complaints of sexual harassment at the workplace in accordance with Indian law.
During 2019, there were 31 breaches (compared with 20 in 2018) of the Code of Conduct. In both 2018 and 2019 there were no convicted cases of corruption at CLP, and 20 cases of whistleblowing (compared with 16 in 2018). The relatively higher number of breaches in the last several years reflects the improved identification and stricter enforcement of work place behaviour requirements.
None of the 31 breaches of the Code of Conduct in 2019 was material to the Group’s financial statements or overall operations. The breaches were mainly related to issues of workplace behaviour and individuals’ ethics and integrity. One of the reported Code of Conduct violations involved an employee at the grade level of senior manager and above.
Learn more about breaches related to Respect for PeopleLegal compliance
Compliance is a basic requirement for maintaining the social licence to operate. CLP’s commitment to comply with laws and regulations is specified in the Code of Conduct. There are additional policies, codes and guidelines that apply to operations and practices under the Code of Conduct including competition law compliance, compliance with personal data and privacy, health, safety and environmental (HSE) policies, and human resources policies, amongst others.
CLP is prepared to forego opportunity or advantage in order to maintain the highest standards of corporate governance and integrity. Beyond compliance, CLP voluntarily follows other standards that reflect the company’s principles and values.
Monitoring and follow-up
One of the responsibilities of the Audit & Risk Committee is to ensure that CLP is satisfying the compliance principles laid out in the Value Framework and the Code of Conduct, as well as compliance with applicable legal and regulatory requirements such as the Listing Rules, the Companies Ordinance and the Securities and Futures Ordinance. The Committee also reviews regulatory and legal cases. Every six months, Group Legal Affairs compiles a “CLP Group Key Regulatory and Legal Compliances Issues Report”, which covers key regulatory compliance issues in addition to legal cases in which CLP is a named defendant for the Board-level Audit & Risk Committee.
CLP is often confronted with changes in the legal and regulatory regimes that affects its operations. The company closely monitors emerging regulations, and ensures that it is prepared for new regulations before they become effective.
Accordingly, CLP reviewed new and amended laws and regulations which came into effect during the 2019 reporting year to identify those which have a significant impact on the business. The threshold applied for assessing the impact of new and amended laws and regulations is whether there is significant investment or expenditure required to ensure compliance. These aspects form part of this review, and the results are described in relevant sections of this report.
Emissions – air and greenhouse gas emissions, discharges into water and land, and generation of hazardous and non- hazardous waste
Employment – compensation, dismissal, recruitment and promotion, working hours, rest periods, equal opportunity, diversity, anti-discrimination and other benefits and welfare
Health and Safety – safe working environment and protecting employees from occupational hazards
Labour Standards – prevention of child and forced labour
Product Responsibility – consumer data protection and privacy
Anti-corruption – bribery, extortion, fraud and money laundering.
To uphold the spirit of transparency and accountability, CLP reports cases of legal non-compliance annually in the Sustainability Report. These include convicted criminal cases against CLP, and major breaches that resulted in significant fines (greater than HK$1 million) or non-monetary sanctions. CLP’s 2019 performance is summarised below, grouped based on the GRI Standards and the HKEx ESG Reporting Guide.
The Company is also exposed to the risk of contractual disputes and litigation in the course of its normal operations. The Group considers each instance separately in accordance with legal advice and will make provision and/or disclose information as appropriate. Refer to Note 30 – Contingent Liabilities in the 2019 Annual Report.
Reportable case of breaches in legal or regulatory compliance in 2019
Risk management
Risk Management Framework
Risk is inherent in CLP’s operations and the markets in which the Group operates. CLP aims to identify risks early so they can be understood, managed, mitigated, transferred or avoided. This demands a proactive approach to risk management.
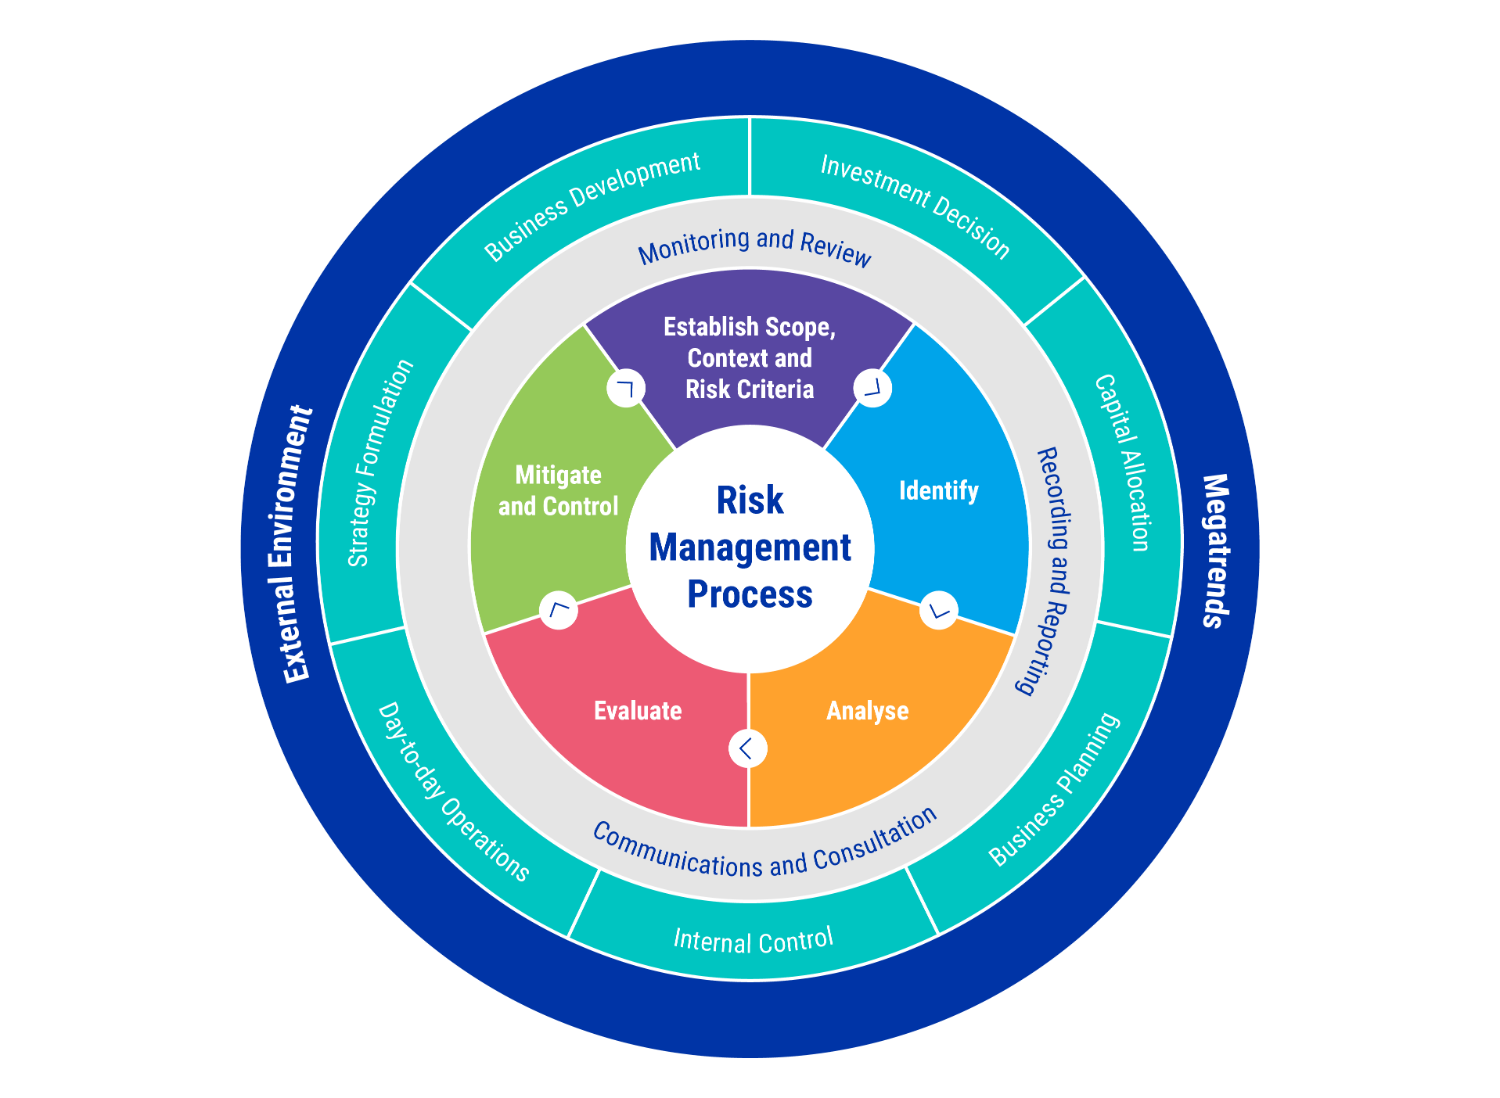
CLP’s risk management framework comprises four key elements:
Risk management philosophy;
Risk appetite;
Risk governance structure; and
Risk management process.
CLP’s overall risk management process is overseen by the Board through the Audit & Risk Committee. There is a strong recognition that risk management is the responsibility of everyone within the Group. Therefore, risk management is integrated into all business and decision-making processes including strategy formulation, business development, business planning, capital allocation, investment decisions, internal control and day-to-day operations.
CLP's risk management objectives are two-tiered:
Strategic
At a strategic level, CLP focuses on the identification and management of the material financial and non-financial risks associated with the pursuit of strategic and business objectives. In pursuing growth opportunities, CLP aims to optimise risk and return decisions as defined and quantified through a diligent and independent review and challenge process.
Operational
At an operational level, CLP aims to identify, analyse, evaluate and mitigate all operational hazards and risks. This is done in order to create a safe, healthy, efficient and environmentally-friendly workplace for its employees and contractors. Other considerations include ensuring public safety and health, minimising environmental impact, and securing asset integrity and adequate insurance.
Risk management framework
Emerging risks
CLP recognises that certain external global trends could have a significant impact on its operating environment. These trends encompass significant political, economic, social, environmental and technological changes, and could rapidly evolve and impact on the context in which the company operates. Because of this, these trends are important in the process of identifying risks that could affect CLP's strategic execution and operational performance. Following a review of dozens of prospective megatrends in 2018 plus additional stakeholder engagement sessions conducted in 2019, CLP reaffirmed that purpose underpins the business as outlined in the CLP Group business section. In addition, the following four material topics were identified as priorities:
Climate change mitigation and adaption
Technology as an enabler and disruptor
Risks to cyber security and data privacy
Ever-changing operating environments require an agile, inclusive and sustainable workforce .
Going forward, CLP will continue to strengthen the integration of ESG risks into its risk management framework and processes, including how climate-related risks at the Group level are consolidated and assessed.
Read more about the key drivers and megatrends affecting CLPClimate change-related risks are embedded in these key risk areas and reported in the Risk Management Report of the Annual Report. In this Sustainability Report, CLP reports on how climate change impacts the Group’s business in the medium- to long-term. Additional information on climate-related risks is disclosed in the Risk Management Report and through CDP.
Find out more on climate scenarios analysis Read about how CLP responds to climate change Read more in the 2019 Risk Management ReportHolistic assessment of new investment projects
The CLP Group Investment Committee is mandated to review and assess acquisitions, investments, project funding, restructures and disposals proposed by the CLP Group. The Committee is made up of senior management and is chaired by the CEO.
Before major investments receive funding approval from the Investment Committee, they are subject to a multidisciplinary review process which includes both financial and non-financial components. Non-financial considerations include safety, security, social, climate change and environmental risks. Early assessment enables a reduction in the business and reputational risks associated with a project and helps guide stakeholder engagement.
Some financial institutions have adopted the Equator Principles to set minimum standards for determining, assessing and managing environmental and social risk. In 2019, around 50% of CLP’s new debt funding supporting Group investment projects with no recourse to CLP Holdings came from banks which have adopted the Equator Principles. This increased from around 40% in 2018.
Details of the non-financial review during pre-development and development of projects are summarised in the table below. For project execution and operation, on-going management is conducted in accordance with CLP operational standards and guidelines.
Health, Safety, Security and Environment management
HSSE Leadership
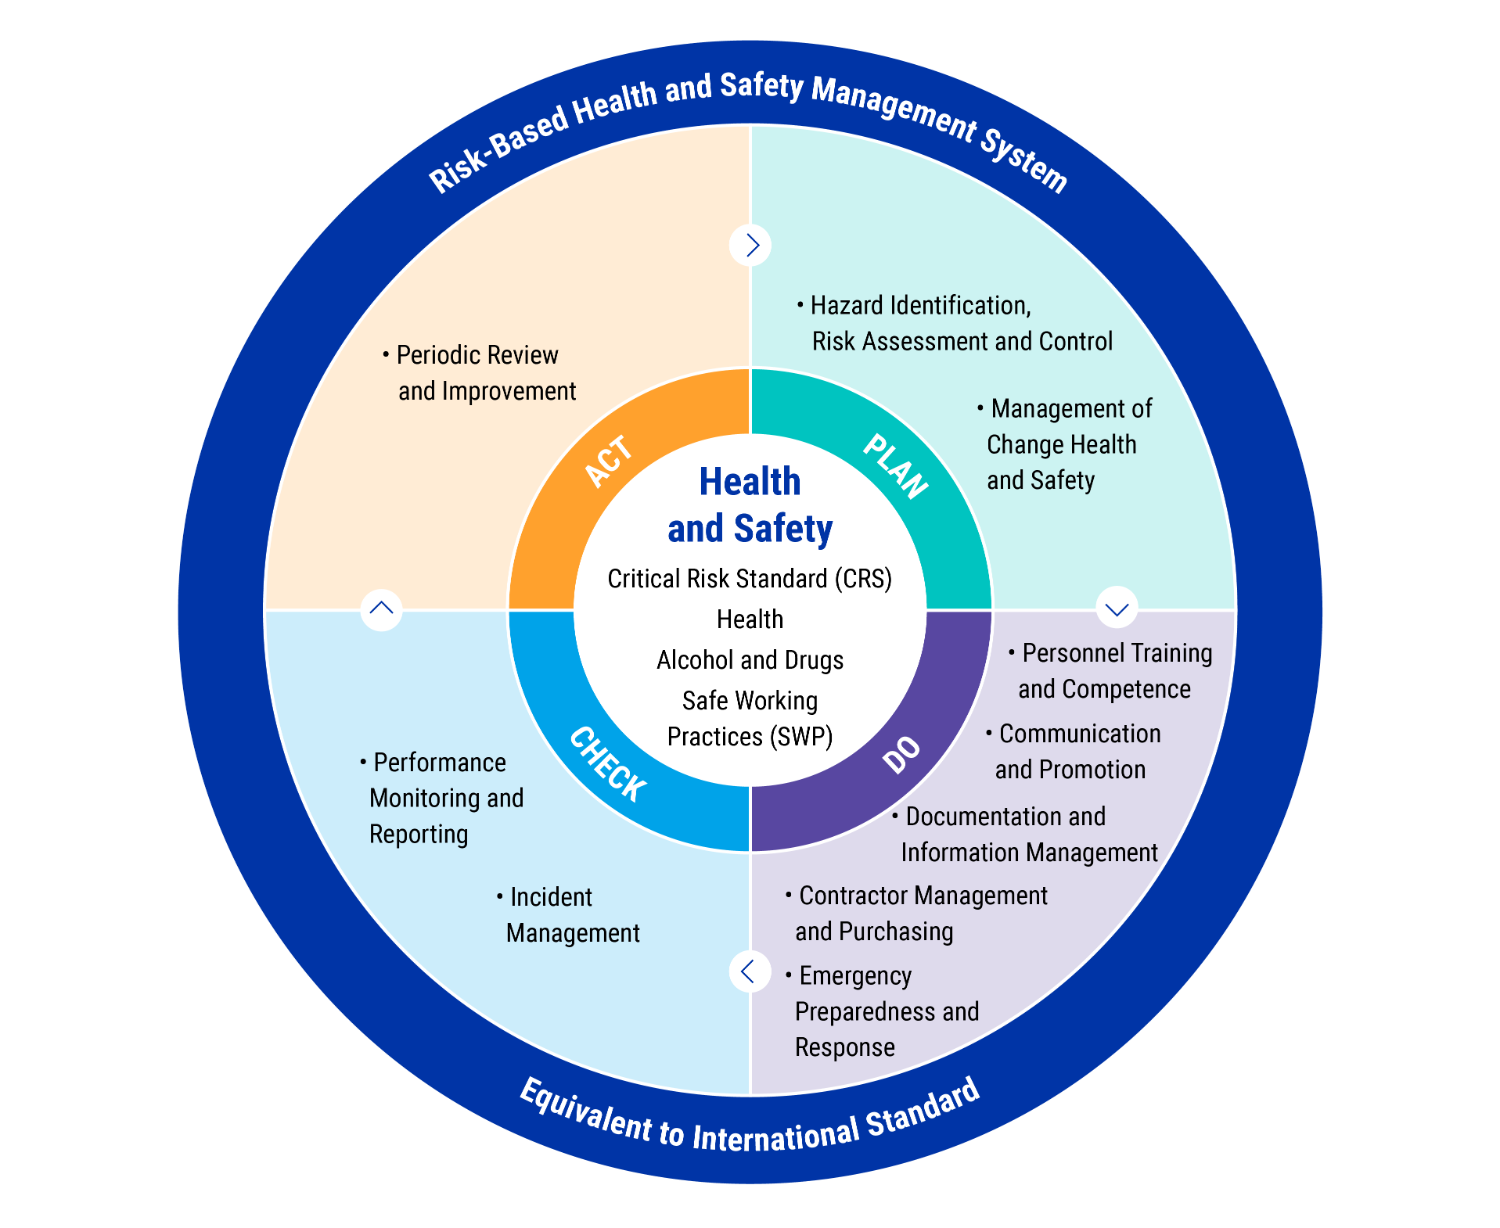
The CLP Group HSSE Management System Standard sets out a structured approach to HSSE risk management, which:
is executed through a set of standards and guidelines to meet the requirements of the policy statements set out in CLP’s Value Framework;
enables the Group’s regional organisations to incorporate HSSE requirements into their business programme; and
promotes and encourages compliance with the international standards for health and safety and environmental management such as ISO 45001 and ISO 14001.
The Standard contains 15 elements, each of which is supported by a set of expectations which encourage excellence in HSSE performance across the Group, while allowing some flexibility for implementation at a regional level.
The effectiveness of the HSSE Framework is reviewed and evaluated by the Board-level Sustainability Committee. CLP’s investment projects also undergo a variety of HSSE assessments. The results are presented to the Group Investment Committee, comprising of senior management and chaired by the CEO, to support decision-making.
Download the HSSE Management System Standard Download an overview of the safety and environmental management systems of CLP’s assetsGoals and targets
To support safe operations, the HSSE plan has clear objectives, programmes, timelines, and quantifiable Key Performance Indicators (KPIs), as well as sufficient resources including HSSE professionals and an appropriate budget.
Operational responsibilities
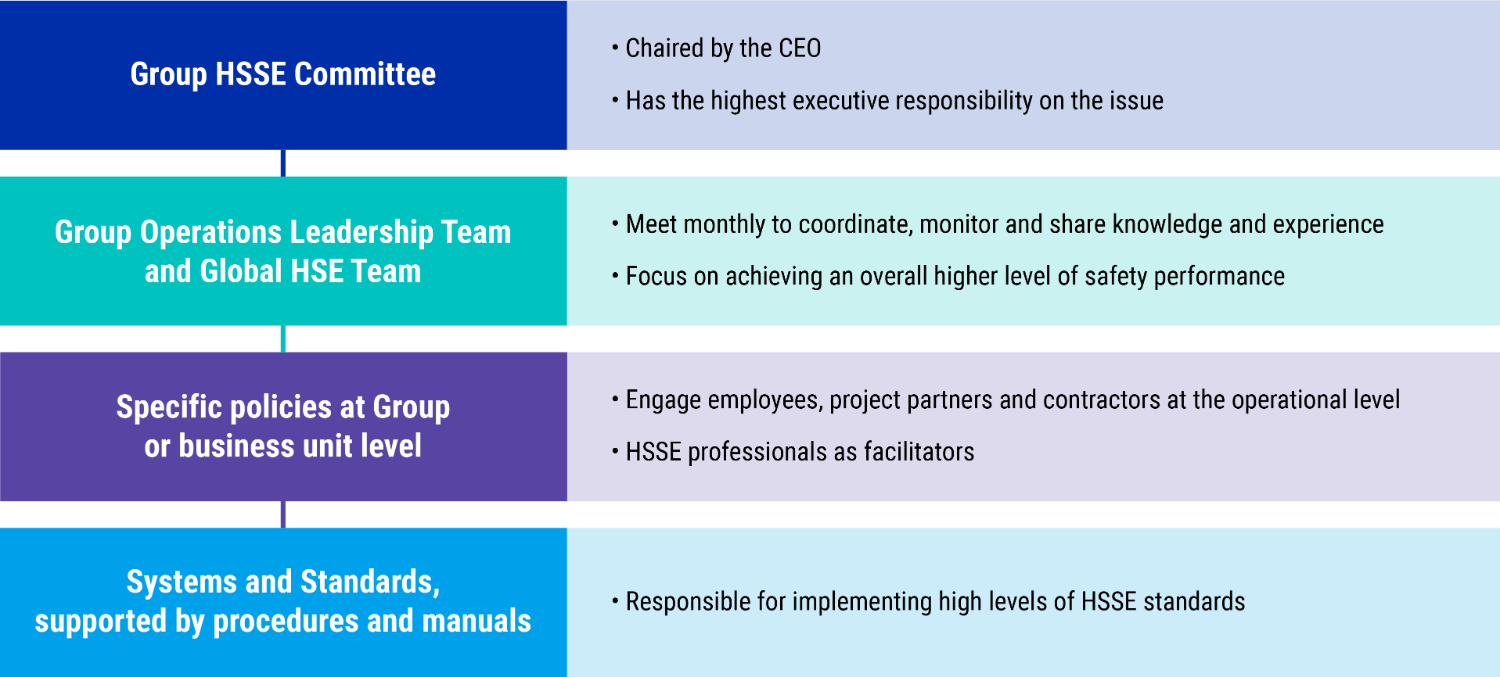
The Group HSSE Committee, chaired by the CEO, has the highest executive responsibility on HSSE-related issues. The Group Operations Leadership Team and the Global HSE Team conduct monthly meetings to coordinate, monitor and share knowledge and experience in HSSE practices across the Group, with a special focus on achieving an overall higher level of safety performance.
In addition, various HSSE committees have been established to engage employees at the operational level, and this also involves project partners and contractors. HSSE professionals facilitate the overall engagement effort and advise on HSSE matters, while the responsibility for implementing high levels of HSSE standards rests with line management.
Continuous improvement
An annual HSSE improvement programme is developed, approved and communicated to staff and contractors in each region. Recommendations are implemented on agreed timescales and programme processes are monitored regularly.
Hierarchy of operational responsibilities
Occupational health and safety
The CLP Group’s HSE Improvement Strategy is based around five pillars, each of which emphasises a key fundamental principle for effective HSE management. It aims to uplift the Group’s safety culture across all operating regions, promotes more proactive risk management, and engages employees, contractors and other key stakeholders in collectively implementing changes to improve safety performance. CLP is committed to ongoing efforts to find new and better ways of working, by learning from investigations into incidents, as well as the adoption of best practices. For instance, the Group has implemented safety improvements for working at height and with other gravitational energies. In addition, Group-wide principles for the safety behavioural framework have been established which set expectations for all levels of the organisation. The Company is continuing to support behavioural safety observation programmes at key Group assets.
As part of Enterprise Risk Management, consistent standards continued to be implemented across the Group for risk management, which includes identifying risks and opportunities.
Download an overview of the safety and environmental management systems of CLP’s assetsGoals and targets
CLP is committed to ensuring all activities and operations result in zero harm for employees, contractors, customers and the public. The Group’s goal is zero fatalities and injuries for employees and contractors. CLP aspires to meet this target as part of its commitment to creating a healthy and safe workplace.
Monitoring and follow-up
The Safety Performance Monitoring and Reporting Standard sets out the safety performance indicators and requirements of safety data reporting. It utilises indicators to show trends which may require more attention to prevent an incident from occurring.
Safety performance is reported internally on a monthly basis. Safety performance data of the assets which fall within CLP’s safety reporting scope is collected and presented in the Group Operations Leadership Team and the Global HSE Team monthly meetings.
Training and awareness
Personnel will only be asked to do work in areas in which they are capable and competent to handle. This requires the careful selection, placement, training, ongoing competency assessment and authorisation of employees, with third-party independent assessment where appropriate. A system is in place to identify and deliver the training necessary to ensure individual competence and knowledge to understand the hazards, risks and control measures associated with their work.
At the asset level, they have the flexibility to structure their own Health and Safety organisations and to design more specific approaches in providing relevant health and safety training, as well as monitoring the percentage of contractors who have undergone the training. Safety training requirements are in all contracts and all contractors are expected to undergo safety training relevant to their duties. Spot checks are conducted to ensure compliance.
Continuous improvement
Thorough investigations have been conducted into all incidents with potential to cause serious injuries with the aim of identifying the root causes. CLP is also committed to understanding how behaviours drive safety performance and continues to support behavioural safety observation programmes in each region.
CLP’s Incident Management Standard sets out the minimum requirements for the implementation and maintenance of a safety incident management system across the Group. In the event of a major incident, the CLP Group Accident Investigation Panel (AIP) and Investigation Report Format Standard are followed. The AIP, chaired by senior members of staff from outside the business unit in which the accident occurred, conducts a thorough investigation. The AIP’s reports are critically reviewed by the Group Chief Operating Officer and the regional Managing Director. The intention is to identify root causes and contributing factors in relation to every incident, and ensure they do not occur again.
The Group is committed to improve its performance as guided by the HSE Improvement Strategy. The following charts show the safety performance of all CLP employees and contractors in the Group and individual regions in terms of the Lost Time Injury Rate (LTIR) and the Total Recordable Injury Rate (TRIR) in 2019. The total number of days worked by contractors and sub-contractors was approximately 3 million man days, assuming a nine-hour work day.
Improving HSE management
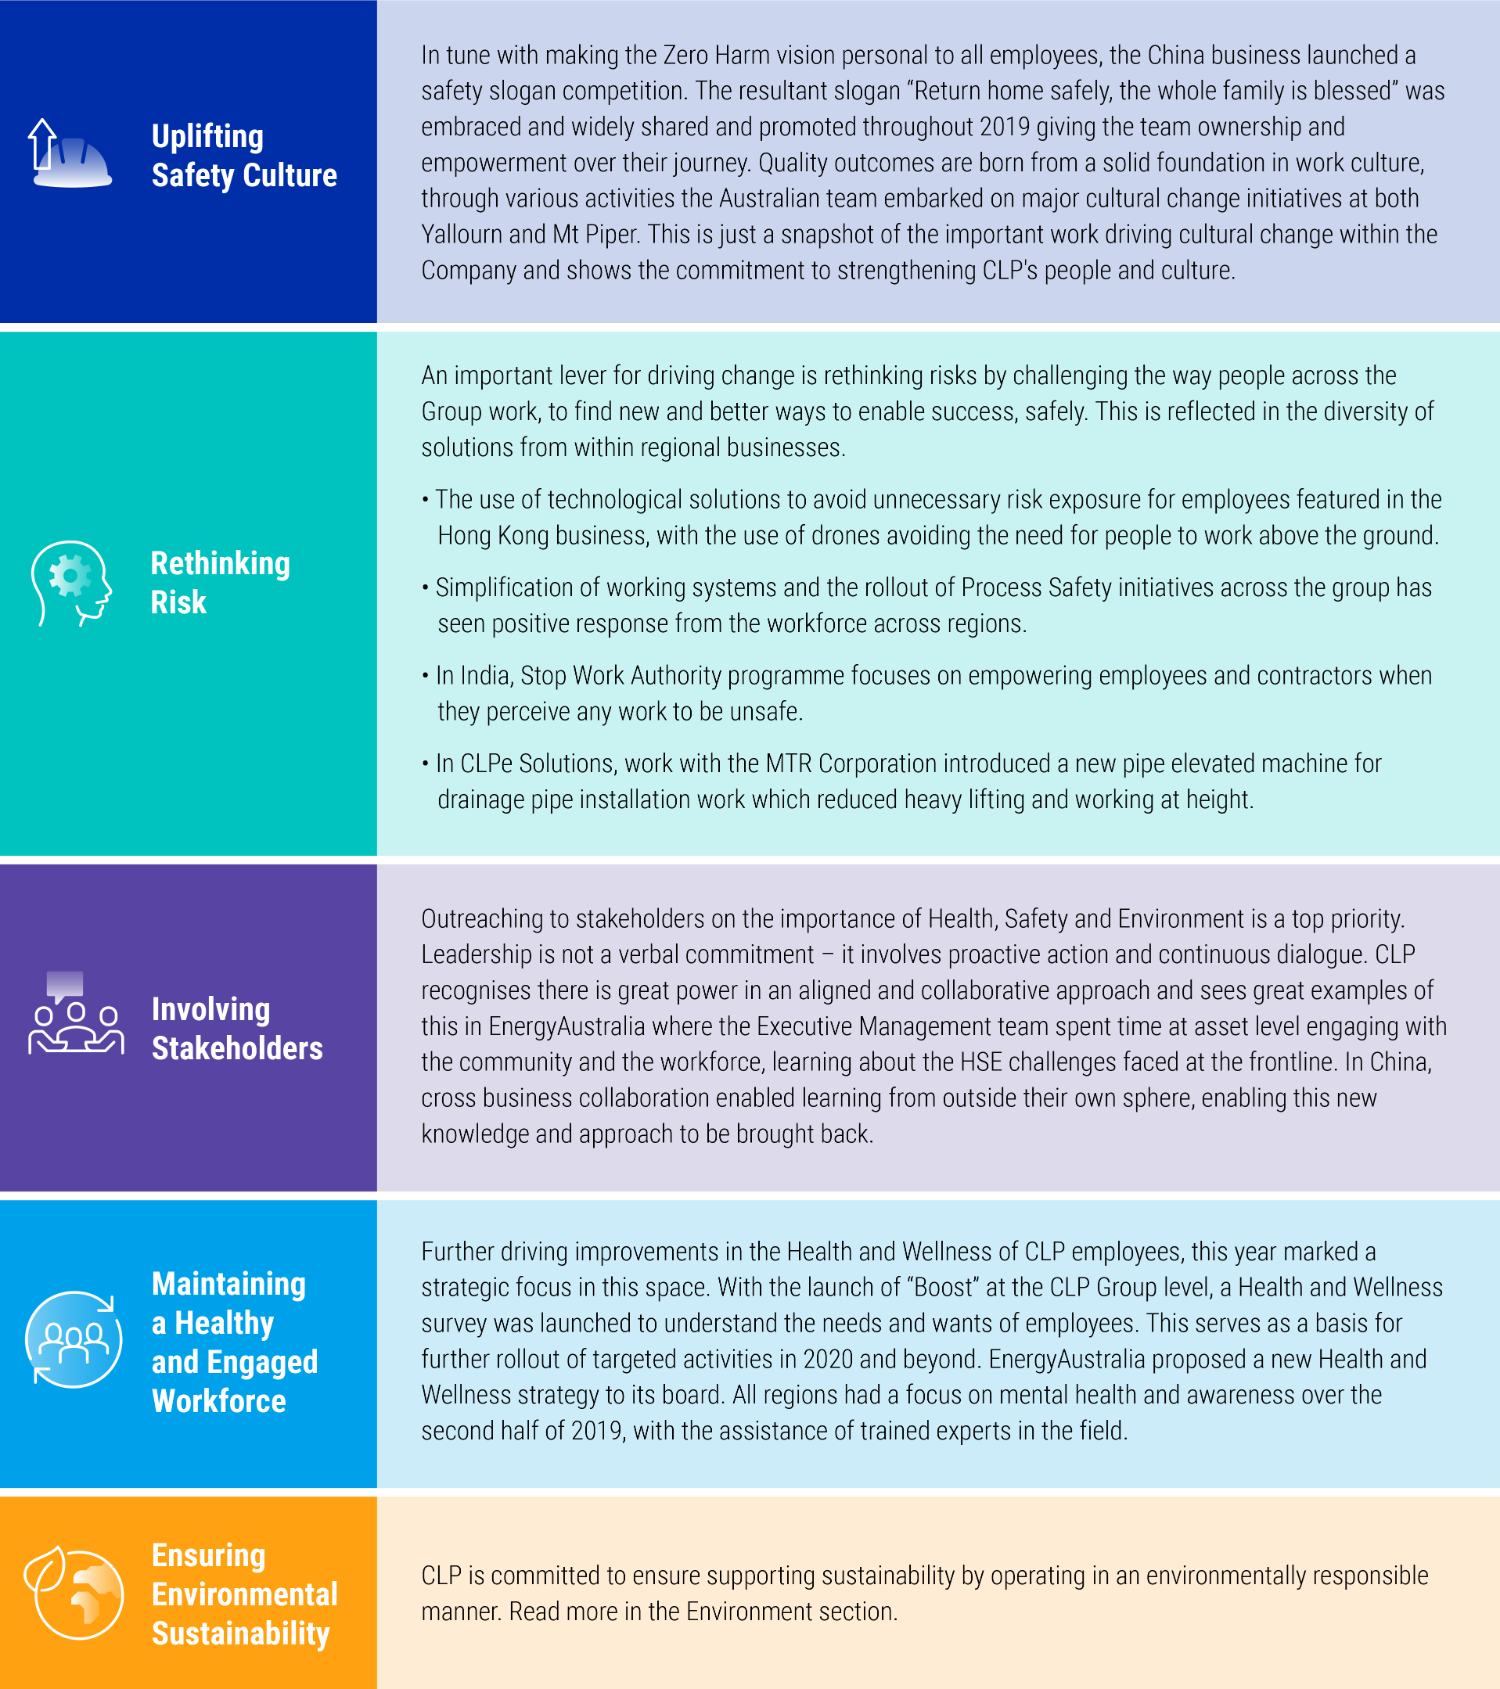
There are five pillars in the HSE Improvement Strategy, which emphasise key fundamental principles to effective HSE management. The critical theme across all pillars is a focus on reducing the number of serious incidents. Each pillar contains a number of elements which work together to deliver the Strategy in a cohesive manner. The Strategy is being implemented over a three-year period, with the focus initially on putting enablers in place, followed by the embedding and review of actions.
In December 2019, CLP undertook a review of the focus areas for the Strategy and concluded that these are the right drivers to deliver improved outcomes for the business. Examples from this year’s activities include:
 Read the year's performance relating to Ensuring environmental sustainability
 Safety around CLP’s network
While the Group’s HSSE Management System Standard sets out an overarching approach to managing the safety risks in operations, responsibility is also taken for preserving public health and safety, including for people who work or stay in proximity to electricity supply lines.
CLP operates a transmission and distribution network in Hong Kong and a transmission network in Shenzhen, Mainland China. In November 2019, a transmission network was also established in India. Working near electricity supply lines can pose public health and safety concerns. The Hong Kong and Mainland China operations conduct regular construction site inspections and provide cable plans and safety talks to road work contractors and site management personnel to enhance safety awareness in all locations. The Fangchenggang Incremental Distribution Network project has commenced operation in January 2020, and there will be continuous HSSE-related training and monitoring referencing CLP’s safety philosophy and best practices as appropriate.
EMF arising from the power system can be another public health concern. Power supply equipment fully complies with the guidelines issued by the International Commission on Non-Ionizing Radiation Protection (ICNIRP). Regular EMF measurements of power supply equipment are carried out jointly with the Electrical and Mechanical Services Department of the government. The measured EMF levels are well below the guideline limits.
Regarding customer health and safety, CLP Power has customer service centres conveniently located in its supply areas in Hong Kong to provide assistance in product safety, as well as advice on energy efficient products, energy saving tips and other account management issues for better quality living. In 2019, there were no reportable case affecting customer health and safety in Hong Kong.
Nuclear safety
Since 1985, CLP has held a 25% equity share in the Guangdong Daya Bay Nuclear Power Station (GNPS), which provides roughly 33% of the electricity supplied to CLP’s customers in Hong Kong. In 2017, CLP’s nuclear portfolio was expanded with a 17% equity investment in Yangjiang Nuclear Power Co. Ltd. which operates Yangjiang Nuclear Power Station (YNPS) in Guangdong. Nuclear power has proved to be a reliable, cost-competitive and clean source of energy. CLP continuously seeks investment opportunities for new capacity in low carbon energies such as nuclear, gas and renewables to realise the Group’s decarbonisation vision.
Nuclear risk management
The safe and steady operation of the two nuclear power stations is always the top priority. The defence-in-depth principle is applied across a full spectrum of areas from design, site selection, operation, radiation protection, environmental monitoring, to emergency preparedness. The safety principle of As Low As Reasonably Achievable (ALARA) is also applied to ensure robust radiation protection.
Through adoption of best international practices in its operation (e.g. IAEA Nuclear Safety Standards), a well-trained and qualified workforce, well-established safety practices and procedures, as well as risk analysis and mitigation, the two nuclear power stations have achieved good performances over a long period.
Download HKNIC’s brochure “Understanding nuclear power” Learn more about the contingency plan of GNPSNuclear waste management
GNPS follows national policy and international practices for nuclear waste management. GNPS stores its spent nuclear fuel onsite in a dedicated storage pool for each reactor. The back-end management of the fuel cycle remains on site for a number of years before being passed on to a service provider licensed by the Mainland Chinese Government for reprocessing. The service provider is supervised by the National Nuclear Safety Administration (NNSA) and its environmental impact is monitored by the Ministry of Ecology and Environment (MEE). The policy in Mainland China on reprocessing spent nuclear fuel is similar to that of a number of European countries.
As the minority owner of GNPS, CLP is not in a position to report the development of back-end management of the fuel cycle in China, including the status of the planned reprocessing plants for spent fuel.
Low- to intermediate-level solid radioactive waste is packed and stored in a dedicated facility onsite on an interim basis, and is secured to prevent unauthorised access. The waste is transferred to a final repository operated by a service provider, using the shallow burial method commonly adopted in the United States, France and the United Kingdom. The operation of the offsite repository is under the supervision of the national nuclear regulator and relevant nuclear safety regulations.
Monitoring and follow-up
Radiation exposure for workers is closely managed by plant operators both collectively and at individual level as part of operating protocols. Workers incur most of their radiation dosage during planned refuelling outages, when much of the work is undertaken at the nuclear generating units. The level of radiation dosage is typically associated with the number of planned outages carried out at the units, which require inspection and maintenance activities in radiation-controlled areas.
Training and awareness
An on-site training school provides professional nuclear training on operational procedures, which aim to enhance nuclear safety and systematically minimise human error. There is a once every two years requalification mechanism to ensure operators’ professionalism and competency in plant operation.
In line with good business practice, GNPS has also provisioned for the expenses associated with the future decommissioning of the plant as required by relevant laws and regulations.
The total quantity of nuclear waste from GNPS was higher in 2019 than in 2018 due to two planned refuelling outages carried out in the year, as opposed to one outage in 2018. The average dose rate in 2019 was less than 0.4 mSv per person per year. For the purpose of comparison, the background radiation dose rate for Hong Kong is 2.4 mSv per person per year from the natural environment.
The charts below show the amount of spent nuclear fuel and low- to intermediate-level radioactive nuclear waste from GNPS over the last several years. The amounts of both types of waste are related to the number of planned refuelling outages in each year.
Environmental management
The material environmental issues covered in the HSSE Framework and the Group-wide Environmental Policy include:
Environmental impact assessments
Environmental monitoring
Environmental management system development
Environmental due diligence
Data management systems.
Strategies and procedures
The Group HSSE Standard states that the environmental risks associated with a project’s operational life-cycle should be appropriately managed. As part of CLP’s Pre-investment Environmental Risk Assessment, an Environmental Due Diligence (EDD) is conducted at the project planning stage, followed by a more detailed Environmental Impact Assessment (EIA), during which air emissions and biodiversity assessments are conducted where applicable.
CLP takes great care in conducting all EIAs and is committed to fulfilling the requirements and recommendations stipulated in EIA reports and local regulations. There is also a process in place to ensure the EIA recommendations are implemented. Planning procedures extend beyond compliance in less developed countries, where regulations are not as mature. For instance, CLP mandates an EIA for all major generation projects in India, even though it is not a statutory requirement for renewable energy projects in the country.
The Environmental Management System Standard is a management tool that helps identify and manage significant environmental risks arising from operations. It also provides a systematic approach to continually improving the environmental performance of assets. CLP requires power generation assets over which it has operational control to achieve third-party certified ISO 14001 environmental management systems within two years from commencement of operation or acquisition. CLP is pleased to report that in 2019, all assets in this category have successfully certified their environmental management system to the ISO 14001: 2015 standard.
Monitoring and follow-up
The Group Operations Information System (GOIS) is a customised system to collect and manage data in relation to asset management, environment, safety and community initiatives. Its built-in data approval sequence and automated presentation and reporting functions strengthen data governance.
CLP recognises that the development of goals and targets can help monitor progress in using environmental resources efficiently. In 2019, the Group started to develop environmental targets for key environmental performance indicators. The data required to support these targets will be collected by the GOIS, enabling regular performance reviews.
CLP has also developed an Environmental Monitoring process to be applied at project level. It specifies how environmental conditions should be assessed and assists with the design and implementation of suitable measures.
Read about how environmental aspects are considered in new projects Download the environmental management systems of CLP's assetsEnvironmental regulations and compliance
It is fundamental that CLP fully complies with applicable environmental laws and regulations in the jurisdictions in which it operates. For new investments, established processes are in place to review relevant environmental requirements.
If an incident occurs at an asset under CLP’s operational control, it is classified and recorded in a timely manner in accordance with the internal process, including notification of any fines or prosecution from local authorities.
The increase in licence exceedances was largely due to the new and more stringent SO2 emission limit introduced since February for Jhajjar Power Plant.
Environmental regulatory requirements are becoming more stringent in many locations. CLP is monitoring these developments closely to prepare for the possibility of additional compliance requirements in future. Any licence exceedances and key emerging environmental regulations that could affect business units are listed below:
Key emerging environmental regulations
Hong Kong
Mainland China
All China assets under CLP’s operational control maintained full compliance with environmental regulations in 2019.
Since the issuance of “Opinions on Formulating and Strictly Observing Ecological Protection Zone” in 2017, 15 provincial-level regions have already set up their ecological "red line" zones, which aim to safeguard the ecological functions and prohibit any incompatible development project. In addition, a digital platform is being set up by the central government to monitor the ecological “red line” zones across the country. CLP continues to closely monitor the potential impacts on its assets and operations in relation to all relevant environmental regulations.
India
In India, further to the enforcement of the new SO2 emission limit by the end of January 2019, there were five minor licence limit exceedances for SO2 at Jhajjar Power Plant in the first half of 2019 but they did not result in any action by the local authorities.
In November 2018, the National Green Tribunal (NGT), a judicial statutory body established by the Indian government for adjudicating environmental cases, passed an order directing all thermal power plants, including Jhajjar, that did not dispose of all fly ash up to 31 December 2019, to deposit damages based on the capacity of the plant. A stay on the enforcement of the order was passed by the Supreme Court. A joint committee set up by the NGT to determine the penalty mechanism for non-compliance in relation to the order submitted its report in December 2019. While Jhajjar successfully disposed of all the ash generated since commissioning up to 31 July 2019, the implications of the report are currently being reviewed.
Deteriorating air quality continues to be a challenge in India and this has captured the attention of the public, the media and policy makers. Therefore, coal-fired power stations face stringent requirements on emissions of particulates, ash utilisation, NOx and SO2.
The Government of India recently announced the National Clean Air Program (NCAP) as a national level strategy to improve ambient air quality within a prescribed timeframe. Since the new air emissions limits at thermal power plants came into force in 2019, Jhajjar has overhauled the Flue Gas Desulphurisation (FGD), Electrostatic Precipitator (ESP) and bag filters to meet the new standards
CLP India actively participated in the Task Force on Clean Industry under the Clean Air Better Life initiative by the Confederation of Indian Industry and NITI Aayog. CLP India worked with relevant policy makers to promote the prioritisation of cleaner power procurement from energy providers who use advanced emission control technologies and cleaner fuels. With CLP India’s clean energy investments, the initiative and the potential regulatory change will offer competitive advantages, and will incentivise the utility sector to accelerate the use of cleaner technologies.
Australia
In Australia, two brief limit exceedances of NOx emission at Tallawarra occurred in February 2019 but did not result in action by the Environment Protection Authority (EPA). Corrective action was implemented during the station outage in 2019 to prevent a reoccurrence of such incidents. At Newport, there was one minor hydrocarbon exceedance to the wastewater treatment network under the Trade Waste Licence in February 2019. There were also two oil spillage incidents in March and August 2019 at Newport resulting in non-compliance. EPA Victoria was notified and no fines or penalties were imposed. Corrective actions have been taken to prevent a repeat of these incidents.
Victorian state environmental legislation and regulations are being revised and are expected to come into force from 1 July 2020. Yallourn, Newport and Jeeralang power stations are working to implement risk controls and ensure compliance with these new standards. In addition, CO2 emissions reduction targets may have implications for Yallourn power station and mine, and the Victorian Government is expected to finalise these targets by the second quarter of 2020.
Detailed site investigations of per- and polyfluoroalkyl substances (PFAS) in soil and groundwater for Jeeralang and Newport are underway and will be completed in early 2020. The findings will help to identify appropriate management actions as required under the Victorian environmental legislation.
Taiwan
In 2019, the effluent standards for power plants were revised under the Water Pollution Control Act which was further supplemented by revised regulations on water pollution control measures and test reporting management. The Ho-Ping Power Company (Ho-Ping), in which CLP has a 20% shareholding, is building a wastewater treatment plant in order to ensure compliance in its effluent quality with the revised standards. The treatment plant is expected to be in full operation in the first quarter of 2020.
Air Emissions
Air quality remains a challenge in many of the geographies in which CLP operates. As the Group expands its renewable and nuclear energy portfolio, air pollutant emission intensities have reduced. Nonetheless, further reductions on the net emissions from thermal power stations remain high on CLP’s agenda.
Strategies and procedures
CLP’s Power Plant Air Emissions Standard stipulates that any fossil fuel-based power plant developed after the effective date of the Standard is required to operate within CLP’s prescribed limits on sulphur dioxide (SO2), nitrogen oxides (NOX) and total particulate matter (total PM), or they must fully comply with local regulations, whichever is more stringent.
Apart from incorporating state-of-the-art air emissions mitigation measures into plant management processes, CLP also designs new power stations with advanced generation technologies that produce electricity as efficiently as technology allows, which assists in lowering emissions and greenhouse gases further.
Monitoring and follow-up
The Company continuously monitors air emissions (SO2/NOx /total PM) from facilities under its operational control using a continuous emissions monitoring system and/or stack sampling and mass-balance calculation methodologies. In addition, CLP regularly monitors mercury emission using stack sampling in accordance with local regulations.
Hong Kong
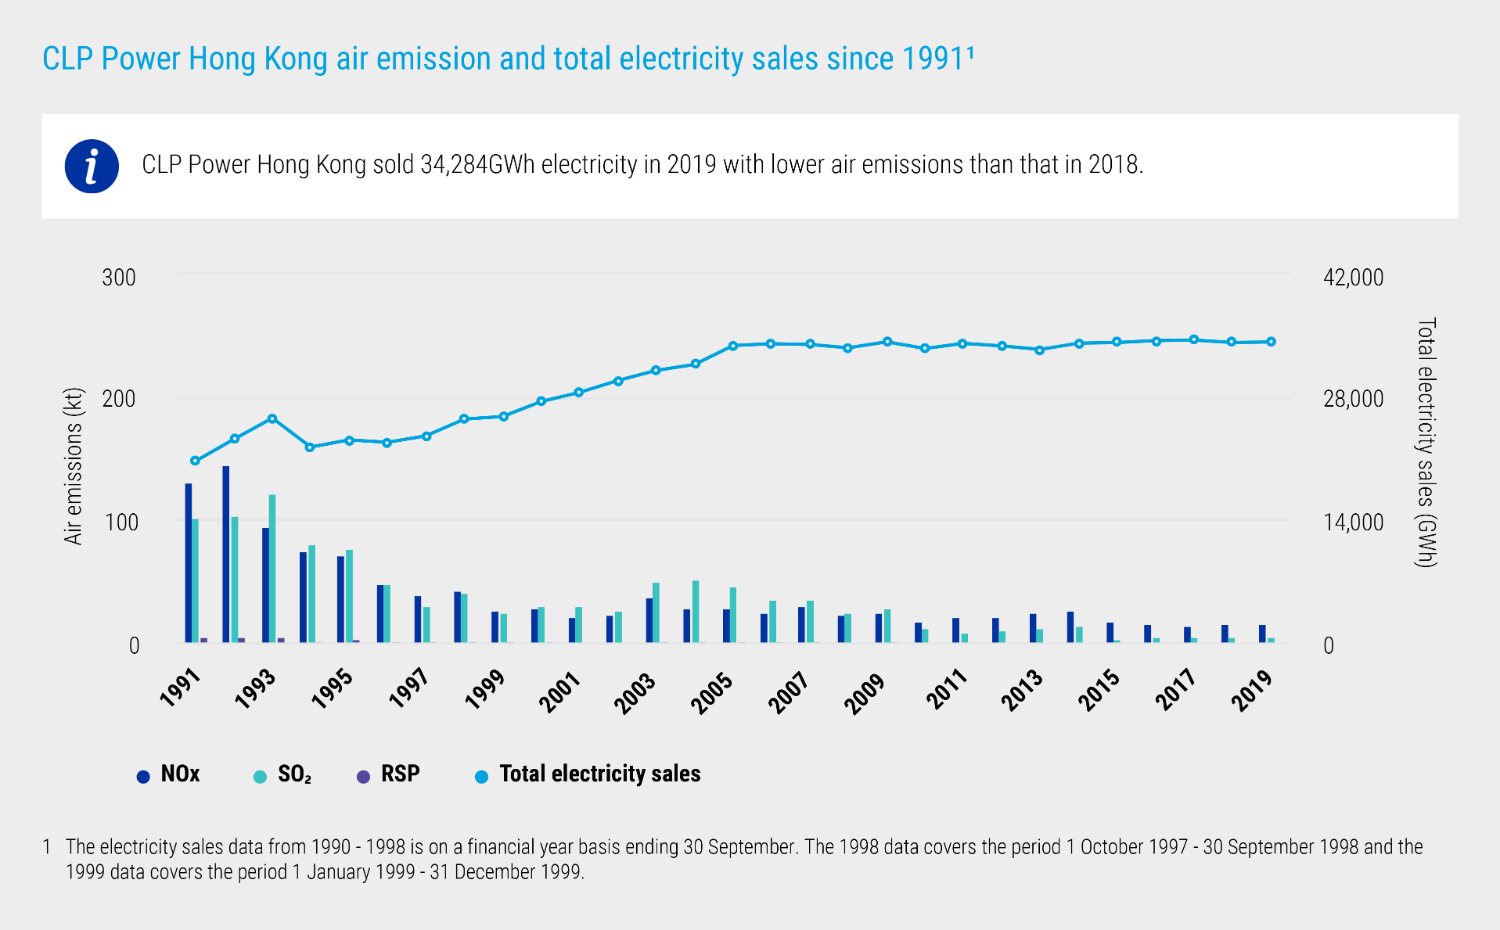
CLP Power Hong Kong has focused its efforts on reducing emissions by continually optimising the diversified fuel mix and maintaining the effectiveness of emissions control facilities. Despite a more than 80% increase in electricity demand since 1990, CLP Power Hong Kong has managed to reduce emissions of SO2, NOx and respirable suspended particulates (RSP) by more than 85%.
The emission allowances of CLP's power plants in Hong Kong have been progressively tightened over time. In 2010, the Hong Kong Government introduced emission allowances under the first Technical Memorandum (TM) of the Air Quality Control Ordinance. Since then, the emission allowances for SO2, NOx and RSP have been tightened by 68%, 38% and 37% respectively. In 2019, the SO2 emission allowance was further tightened by 4% from the very tight base of 2018. CLP Power Hong Kong has fully complied with these targets.
From April 2019 onwards, CLP Power Hong Kong began to measure and report mercury emissions in compliance with the new emission limit for the Castle Peak Power Station. All the measurements in the year were well below the limit, achieved through maintaining the effectiveness of emission control equipment and the control of the mercury content in coal. CLP Power Hong Kong is also aware of the high global warming potential of sulphur hexafluoride (SF6), an insulating gas commonly used in switch gears and transmission lines, and is vigilant in the control of SF6 leakage throughout the life cycle of electrical equipment.
Mainland China
The Fangchenggang Power Station continued to perform well after the completion of the upgrade in emission control equipment for SO2 and NOx. In addition, a pilot project is underway to use the CO2 from flue gas to cultivate microalgae. This will in the future offset some CO2 emission from the plant.
India
CLP India has further reduced SO2 emissions from Jhajjar Power Plant, and upgraded its continuous emission monitoring system (CEMS) to improve accuracy in measurement.
Australia
The Tallawarra Power Station upgraded its continuous emissions monitoring system (CEMS) in 2019 to ensure the plant had the most accurate data for keeping emissions as low as possible. Mt Piper installed a CEMS unit as part of a programme to improve emissions monitoring and performance.
CLP India contributes to air quality improvement
In addition to the emission control projects in the Jhajjar Power Plant, CLP India has partnered with the CII Foundation on a community programme to encourage local farmers to adopt sustainable methods of crop residue management in Haryana.
The two-year project will cover an estimated 9,000 acres of farmland and will initially be implemented in six villages in the districts of Rohtak and Fatehabad in Haryana.
The project is being executed with the help of local non-profit partners and farmer groups. It includes a series of community engagement campaigns to raise awareness and capacity amongst farmers for adopting sustainable and eco-friendly methods of straw management. In the second phase of the project, farmers have been provided with in-situ crop residue management farm tools and technologies for better straw management.
The programme will provide financial support to farmer groups for procuring or hiring high-powered tractors (required for operating in-situ machines) and balers (for clearing straw from the field if there is no scope for in-situ straw management). These machines cut the crop residue, mix them with soil to improve soil health, and plant the seeds for the next batch of crops, thereby saving time, energy and money as compared to conventional methods.
Crop residue burning not only contributes towards harmful emissions, but also depletes essential nutrients from the soil. The project aims to stop crop residue burning in the state, which is a fundamental change in the farming practices in the region, thereby improving the local air quality.
Read more on how CLP India helps tackle air pollution
Stubble burning generates heavy smoke and worsen air pollution
Waste
Strategies and procedures
CLP endeavours to reduce both the hazardous and non-hazardous waste it produces, and works with qualified parties and partners to reuse or recycle whenever possible. All wastes are managed according to the waste management hierarchy (i.e. prevent, reduce, reuse, recycle, replace, treat and dispose). CLP seeks to avoid the use of hazardous materials and replace them with alternatives wherever possible. All hazardous and non-hazardous wastes are managed in accordance with local regulations, collected by licensed collectors, or sold for recycling. Waste generated from renewable assets is also managed in the same manner.
At CLP’s coal-fired power stations, coal ash from coal combustion and gypsum from the flue gas desulphurisation process constitutes the majority of generation by-products. The aim is to use them as a resource for construction and other applications in line with local regulations and practices rather than disposal.
Monitoring and follow-up
CLP monitors its waste generation monthly by tracking solid and liquid forms of hazardous and non-hazardous waste produced and recycled at its facilities.
CLP continued to sell its generation by-products such as ash and gypsum for use in other industries where feasible. The Group’s power stations run different programmes to manage waste, and learnings are shared with both colleagues and contractors to raise awareness and build capacity. Key programmes in 2019 included:
Jhajjar Power Plant: CLP India has been taking enhancement measures in its ash handling system and actively seeks ash utilisation opportunities with other industries such as road construction, cement plants and brick-making plants. In 2019, Jhajjar achieved 100% utilisation rate of the ash generated, and furthermore cleared all the ash stored in the ash dyke.
Jinchang Solar Power: CLP China continues to utilise the initiative from solar panel manufacturers to take back any damaged panels for recycling.
Fanchenggang Power Plant: CLP trialled using white mud, a by-product generated by a paper mill factory, to partially replace the use of limestone in the plant’s flue gas desulphurisation process. Around 5,300 tonnes of white mud was used in the trial, reducing use of raw materials in plants and solid waste production from the paper mill.
CLP Power Hong Kong: Single-use polyfoam meal boxes in staff canteens were all replaced by corn-based biodegradable products, reducing the use of around 26,000 single-use plastic meal boxes a year.
Water
Strategies and procedures
The quantity of water withdrawal and discharge in CLP’s operations is dominated by thermal plants using once-through seawater cooling. In this process, large quantities of seawater are used for cooling and returned to the sea with only a slight increase in water temperature. The total volume of water withdrawal and discharge is dependent on the total electricity generated.
Where freshwater is withdrawn for operations, CLP strives to reduce water use and reduce the freshwater intensity of the electricity generated. It is also important to ensure water availability in these plants to ensure operations will not be disrupted.
Monitoring and follow-up
The Company assesses water availability in the planning stage of projects including the likelihood of water scarcity in the future and during plant operations. Engaging with and understanding the needs of local stakeholders is also prioritised, to ensure the licence to operate is maintained. As a result of the water treatment processes put in place, none of CLP’s operations significantly impact their respective water receiving bodies.
Also carried out at the planning stage of development projects are water quality impact assessments, in accordance with local requirements. This is to ensure that any impacts associated with the project construction and operation are managed and mitigated to an acceptable level.
In-depth assessments on water risk in the generation portfolio are conducted regularly, including using globally recognised tools such as the World Business Council for Sustainable Development (WBCSD) Global Water Tool and World Resources Institute (WRI) Aqueduct. The assessment covers parameters such as water availability, water sensitivity, water stress mapping, potential competing use with other stakeholders, and the management strategies in place in each of the regions. The results of the assessment confirmed that CLP has a sufficiently robust regime in place for managing water risks.
CLP also participates in the CDP water survey to disclose and benchmark its practices with industry peers in relation to water resource management. The company is committed to continuing to monitor its water use and manage this precious resource carefully.
CLP’s power stations, in particular the fossil-fuel fleet which uses more water, carry out a range of water conservation initiatives depending on site conditions, operational situations and age. The amount of water which can be recycled depends on factors such as location, power station design, and regulatory requirements. CLP encourages its power stations to track their total water recycling and report this for indicative purposes. Considerable emphasis is placed on sharing initiatives across the CLP Group to maximise the benefit of an individual power station’s efforts.
Three of the CLP Group’s thermal power stations, Fangchenggang, Jhajjar and Mount Piper, operate on a zero liquid discharge basis. The water is treated internally and recycled or reused in other parts of the power generation process, or for dust control or horticulture. For instance, the Fangchenggang Power Station in Mainland China uses treated greywater to reduce the use of freshwater in the flue gas desulphurisation process. The Jhajjar Power Plant in India operates on the basis of using river water with limited or no water discharge. It is designed with a water re-circulation process, requiring limited quantities of water to be topped up to make up for evaporation losses. In June 2019, CLP India received the Second Runner Up Jury Special Mention Award in an award programme organised by Frost & Sullivan and The Energy and Resources Institute for the Jhajjar plant’s achievements in water management.
In Australia, construction of the new 14 km water transfer pipeline and water facility to support the long-term operation of the Mount Piper Power Station was completed in 2019. Since commissioning, water is sourced from the nearby Springvale mine to augment cooling water supplies to the power station. Consequently, the operation of the station will no longer require water from local catchments for its cooling system and therefore there will be no discharge from the mine into the local river systems.
CLP’s solar farms seek to achieve zero-water for cleaning
CLP’s solar farms require water, although in relatively small quantities, for cleaning purposes.
Manual cleaning is the most widely adopted method. However, depending on site conditions (e.g. swamp areas) this may pose safety risks to the cleaners. Cleaning during the daytime also reduces the productivity of the plant.
The Group is currently exploring innovative technology to achieve low water use targets for dust removal on solar panels. In 2019, CLP completed a pilot project to use robotic cleaning which uses brushes instead of water for cleaning of solar panels in the Sihong and Veltoor solar farms in Mainland China and India. These projects did not only achieve zero use of water for cleaning, but could also potentially increase the efficiency of electricity generation. These successes set a precedent for the wider deployment of the technology in the future.
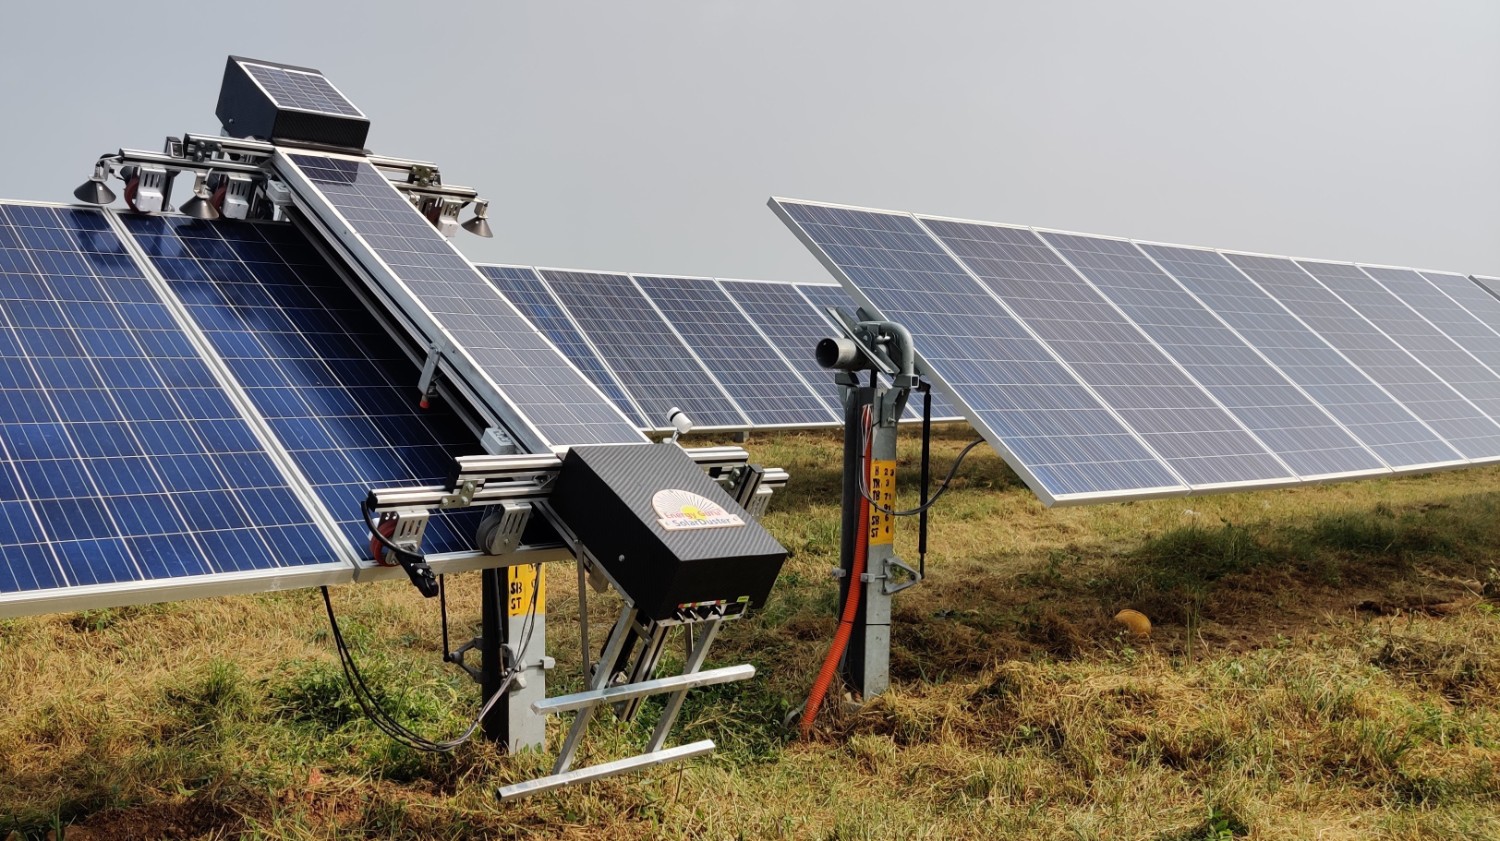
Dry cleaning robot in Veltoor solar farm in India.
Biodiversity and land use
Goals and targets
The Group’s goal is "no net loss of biodiversity". Targets are site-specific depending on the different levels of regulatory controls on biodiversity, from assessment requirements to ecological compensation. For example, the target is a net gain in the habitat hectare score at the Yallourn mine’s programme in Victoria.
Strategies and procedures
In addition to implementing an internal Environmental Impact Assessment (EIA) standard that mandates an environmental assessment for all new projects, the Biodiversity Impact Assessment Guideline provides a framework for a more systemic assessment of biodiversity impacts. The Guideline under the HSSE management system is applicable to power generation, transmission and distribution, mines and other power-related projects.
During the EIA stage, CLP partnered with qualified personnel to conduct biodiversity impact assessment. The Biodiversity Impact Assessment Guideline provides guidance on managing biodiversity risks where appropriate, and considers the IUCN Red List of Threatened Species and national conservation lists of threatened species. Any new operations that could affect the IUCN Red List of Threatened Species and national conservation list species are flagged well ahead of any investment decision. The assessment also describes the baseline conditions, evaluates the magnitude and significance of project impacts, and investigates options for mitigation. If necessary, the assessment contemplates offsets after considering options relating to avoidance, minimisation, and restoration or rehabilitation. The assessment also observes local legislative requirements and references the International Finance Corporation Sustainability Framework.
See CLP's holistic approach in assessing new investmentBiodiversity
Much of the biodiversity work across the Group is ongoing. This includes activities such as vegetation management along transmission lines in Hong Kong, the fish management regime in place at the Jiangbian hydro power station in Mainland China, and the tree management work undertaken by the Jhajjar Power Plant in India.
For the transmission and distribution network in Hong Kong, CLP closely monitors the growth and the condition of trees and vegetation in the vicinity of overhead lines and has a tree inventory to identify any hazardous trees which will affect the overhead's lines operation. To support the Hong Kong Government’s Strategy of "Right Tree in the Right Place", any hazardous trees identified will be replaced with native species to support local biodiversity.
The Hong Kong Offshore LNG Project, further to the Environmental Impact Assessment (EIA) approval obtained in October 2018, has commenced marine mammal baseline surveys since June 2019 in the southern and western Hong Kong waters to establish the baseline conditions of the Chinese white dolphins and finless porpoises as part of the Environmental Monitoring & Audit programme.
In Mainland China, the Xundian wind farm has completed its 3-year post-commissioning bird monitoring of the nationally-protected species, black-necked crane. The monitoring was conducted in accordance with the EIA recommendation which considered that the project location is in the vicinity of the black-necked crane provincial nature reserve. Monitoring results together with the expert review panel concluded that there has been no direct impact on the birds due to the operation of the wind farm.
At the Mt Piper Power Station in Australia, CLP has received approval to build the Pipers Flat Rail Coal Unloader to supply the power station with new sources of coal. CLP is also establishing a permanent biodiversity offset area which will improve the long-term biodiversity values of the rail unloader offset site. The biodiversity offset site is close to the power station and the habitats protected include grassy woodlands and dry forests.
Land remediation
The Wallerawang power station in New South Wales continues to progress to the completion of the demolition and rehabilitation of the site. The power station internals have largely been removed. Demolition has been approved and relevant material will be disposed of in an approved new asbestos disposal area. Clean fill from a tunnel project in Sydney has been secured and will be imported to the site to act as capping material for Wallerawang power station assets.
Climate action finance
Strategies and procedures
The Climate Action Finance Framework (CAFF) supports the transition to a low carbon economy by attracting socially responsible, sustainable financing. It supports CLP’s investments in reducing carbon emissions and increasing energy efficiency. Established in July 2017, the CAFF sets out how CLP proposes to raise climate action bonds (CLP Climate Action Bonds) to invest in projects consistent with both the Group’s investment and climate strategies. CLP Group’s majority-owned business units may issue bonds under the CAFF, and there are two types of Climate Action Bonds:
New Energy Bonds – the proceeds of which help develop renewable energy, energy efficiency and low emissions transportation infrastructure projects
Energy Transition / Emission Reduction Bonds – the proceeds of which help develop gas-fired power plants to support the transition from coal-fired generation in markets with limited renewable energy resources.
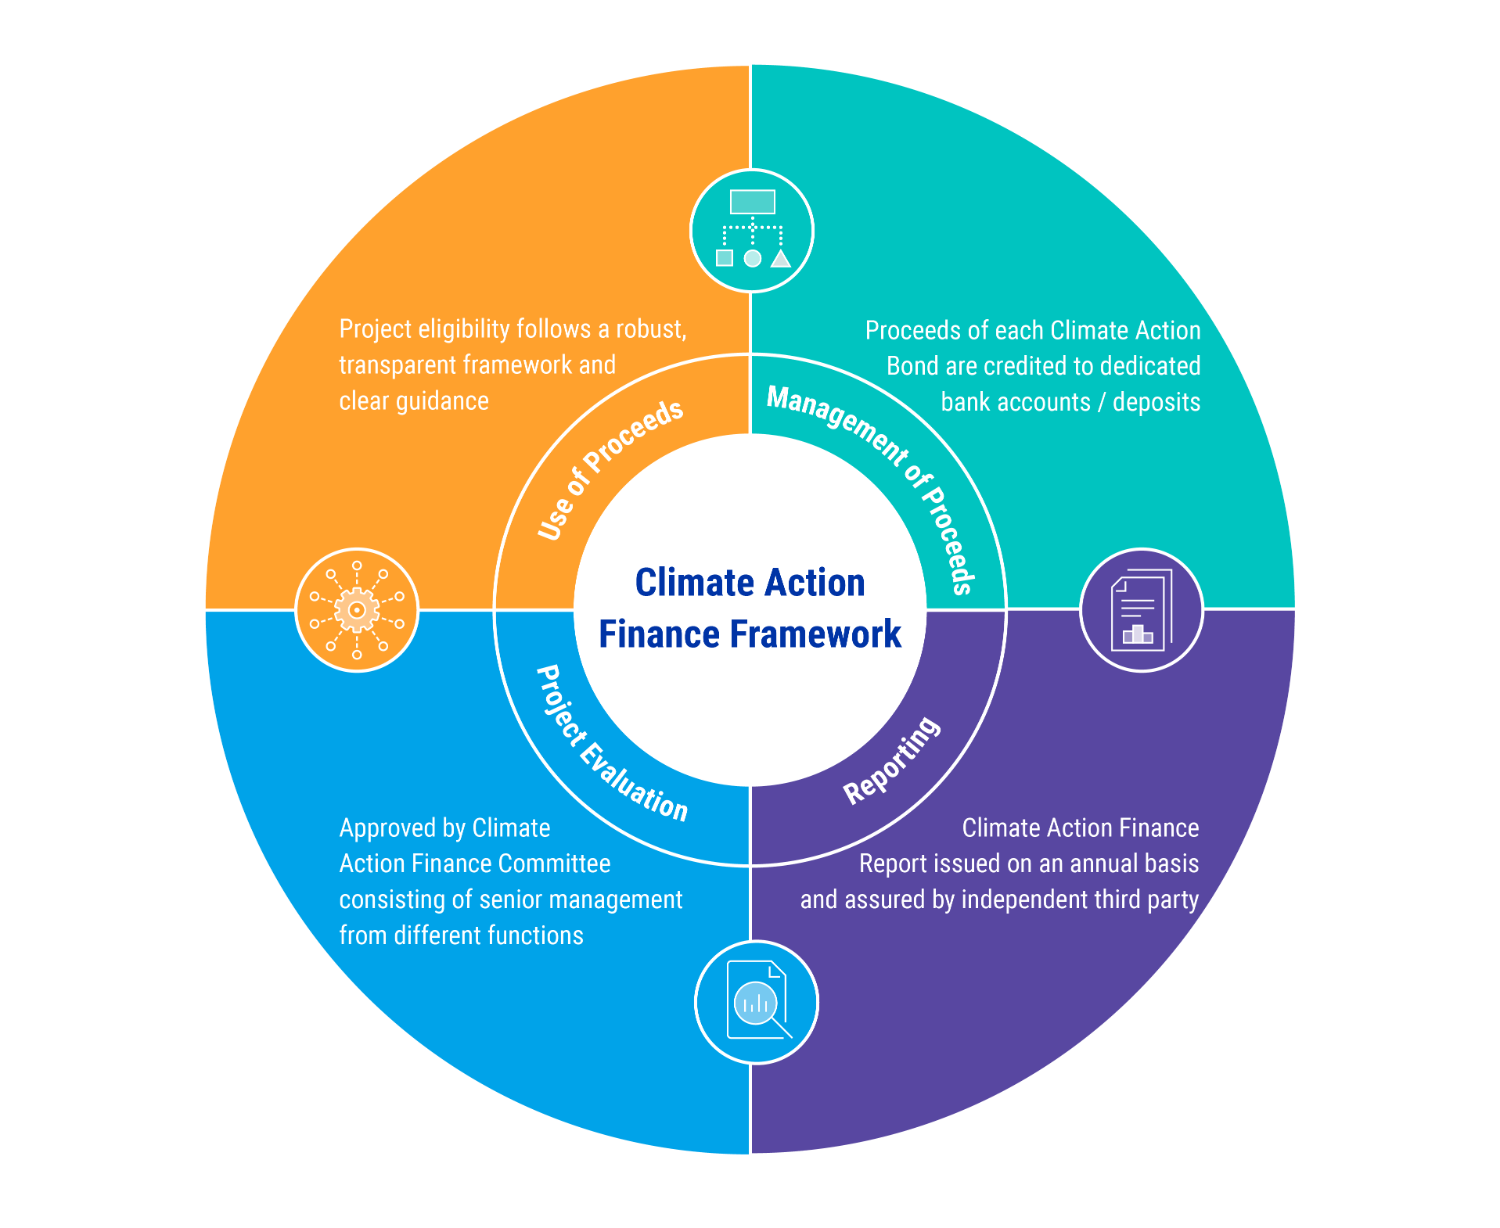
New Energy Bonds are aligned with the Green Bond Principles, which provide guidance in four key areas: the use of proceeds, the process for project evaluation and selection, the management of proceeds as well as reporting. Energy Transition/ Emission Reduction Bonds are aligned with the governance components of the Green Bond Principles, including the process for project evaluation & selection and management of proceeds & reporting.
Operational responsibilities
All eligible projects of the CAFF undergo a rigorous review and approval process within a transparent framework and clear guidelines. CLP has established a Climate Action Finance Committee with the responsibility for governing the CAFF. The Committee is responsible for approving the issuance of Climate Action Bonds and determining the eligibility of the proposed use of proceeds. Committee membership consists of the CLP Executive Director and Chief Financial Officer, and senior management from the sustainability, finance and legal departments.
Monitoring and follow-up
All bond proceeds must deliver clear environmental benefits through investment in qualified projects identified by a transparent screening process. Controls are also in place to ensure that bond proceeds are only used for designated green projects. CLP produces a Climate Action Finance Report annually to help track the appropriate use of bond proceeds and provide insight into their estimated environmental impact. The content of the report is independently assured by an auditor.
Climate Action Finance Framework
The first Climate Action Bond was issued in July 2017. In 2019, CAPCO issued the second bond under CAFF as a HK$170 million 25-year fixed rate New Energy Bond to fund the construction of the West New Territories Landfill energy-from-waste project in Hong Kong. This was the inaugural green bond for CLP’s Scheme of Control business. The energy-from-waste project allows CAPCO to utilise landfill gas as an energy source to offset its coal-fired power generation and reduce emissions from coal burning.
Download CLP's 2019 Climate Action Finance Report Download the Indepdent Assurance Statement for the 2019 Climate Action Finance ReportGreenhouse gas emissions
The GHG intensity of the electricity CLP generates is one of the targets in the Company’s Climate Vision 2050. A Group-wide GHG reporting guideline was first developed in 2007. CLP is reporting GHG emissions with reference to the following international standards and guidelines:
The Greenhouse Gas Protocol: A Corporate Accounting and Reporting Standard (Revised Edition) of World Business Council for Sustainable Development (WBCSD) and The World Resources Institute (WRI)
The Greenhouse Gas Protocol: Corporate Value Chain (Scope 3) Accounting and Reporting Standard
The Greenhouse Gas Protocol: Technical guidance for Calculating Scope 3 Emissions (Version 1)
IPCC Guidelines for National Greenhouse Gas Inventories, 2006
IPCC 5th Assessment Report, 2014
International Standard for GHG Emissions ISO 14064-1
CLP obtains emission factors from the local governments and authorities in jurisdictions where the different business units operate. In cases where local emission factors are not available, other recognised sources are referenced.
CLP’s GHG emissions inventory covers the six GHGs1 specified in the Kyoto Protocol. Nitrogen trifluoride (NF3), the seventh mandatory gas added under the second Kyoto Protocol, was also considered for inclusion, but after evaluation was deemed immaterial to operations.
Scope 3 GHG emissions
CLP has been focused on measuring its Scope 1 GHG emissions as that is the main emission type from its generation business. Conscious of emissions along the value chain, in 2019, the Company conducted a comprehensive review of its Scope 3 emissions, and from this report onwards will add disclosure of Scope 3 emissions to present a more comprehensive view of its footprint along the value chain.
Conducting a Scope 3 screening exercise is the first step to understanding all sources of emissions and identifying the material categories for reporting. Like many industries, electric utilities may have limited influence or control over some Scope 3 emissions categories. CLP will monitor its Scope 3 emissions particularly if they represent an increasing portion of the total carbon footprint.
Goals and targets
As presented in CLP’s Climate Vision 2050, the decadal carbon intensity targets have been strengthened in 2018 to reflect the increasing pace of transition in key markets and globally. CLP also created targets for renewable energy and non-carbon emitting generation.
Learn more about CLP's GHG emissions goals and targets in Climate Vision 2050Monitoring and follow-up
CLP manages the GHG emissions from its generation business by adopting a rigorous Asset Management Framework. Asset performance metrics are utilised and established Engineering Standards and Guidelines are applied, aligning with operational protocol for delivering reliable electricity.
The internal GHG emission reporting guideline is reviewed in accordance with CLP practice at least once every three years.
CLP has been disclosing the combined total Scope 1 and Scope 2 GHG emissions on an operational control basis for more than a decade. This compilation basis represents the total GHG emissions from generation assets where CLP has direct influence and control on operational matters. This will continue to be disclosed for better year-on-year comparison.
At the same time, a better reflection of CLP’s investments in decarbonisation efforts is gauged through GHG emissions based on equity and long-term capacity and energy purchase. Purchase agreements help the Group meet local market needs and usually entail significant investment. In addition, this figure allows customers to better understand the carbon intensity of the electricity CLP provides. In order to qualify for inclusion in this metric, these long-term capacity and energy purchase agreements must have a duration of at least five years and the equivalent capacity of 10MW or more.
Progress of Climate Vision 2050
Under the new reporting basis of including long-term capacity and energy purchase agreements, CLP’s progress against its CV2050 targets are summarised below. Intensity measured on an equity only basis continues to be reported to allow for year-on-year comparisons.
Scope 3 emissions of CLP
Fuel- and energy-related activities were identified as the most material for CLP among the 15 categories of Scope 3 emissions, followed by Use of Sold Products and Capital Goods. These three categories account for around 90% of CLP’s Scope 3 emissions.
CLP's view on Hong Kong’s Decarbonisation Strategy
Land constraints and the densely populated nature of developable land in Hong Kong have always posed a challenge for the city’s deployment of large-scale renewable energy projects.
While taking this into consideration, CLP issued a public response to The Council for Sustainable Development’s public engagement on the Long-term Decarbonisation Strategy launched in June 2019, expressing support to the need for deep decarbonisation of electricity generation. CLP’s response highlighted the challenges and opportunities of different pathways to increase long-term low-carbon electricity generation and/or source more zero-carbon energy through regional cooperation. The potential opportunities associated with latest technologies such as zero-carbon hydrogen or carbon capture and storage were also discussed.
Download CLP Power’s response to the consultation paperCLP’s response aligns with the Five-year Development Plan (2018-2023) which outlines a focus on gradually migrating to a generation fuel mix composed mainly of natural gas while reducing the use of coal in electricity generation. The Development Plan also highlights several important capital projects crucial to accelerating CLP’s transition to lower-carbon energy, including the new 550MW gas-fired generation units at the Black Point Power Station and the construction of the offshore liquefied natural gas (LNG) terminal that will provide a more secure long-term alternative source of natural gas. It also includes the landfill gas power generation system at the West New Territories Landfill in Hong Kong, as well as the enhancement of the Clean Energy Transmission System connecting the CLP grid to Guangdong. Find out more here.
Preparing for carbon trading
Negotiations on carbon trading at COP25 were focused on Article 6 of the Paris Agreement, with a view to creating a new financial instrument that would enable a transparent trading mechanism for countries to meet national emissions reduction pledges. Challenges remain for negotiators to agree on a framework that will be flexible enough to attract investment while alleviating uncertainty as to how Clean Development Mechanism (CDM) credits, a legacy of the Kyoto Protocol that laid out the rules for a global carbon trading mechanism, would transfer to the new scheme under Article 6.
The Mainland Chinese Government officially announced the establishment of a national Emissions Trading Scheme (ETS) in December 2017. In the initial phase, the national ETS covers only the power sector with a view to gradually expanding to other key emitting sectors. Throughout 2019 the Government focused on the development of market infrastructure. The Ministry of Ecology and Environment (MEE) successively released draft regulations of the national ETS for comments and organised a series of training workshops across the country to provide carbon management knowledge and test allocations for the covered entities. In response, CLP China set up a dedicated carbon management team to monitor its carbon portfolio in Mainland China and the development of the national ETS. The Group’s assets are making appropriate preparation for the upcoming carbon market, including the Fangchenggang Power Station, to monitor, report and verify its carbon emissions.
The Government of India has not yet made an announcement pertaining to any domestic compliance and carbon trading schemes. Currently, all renewable energy generation projects of CLP India are registered in Clean Development Mechanism (CDM) and Voluntary Carbon Standard (VCS), and carbon offsets generated from these projects are being traded in the international markets. CLP India is still operating one coal-fired power plant in Jhajjar, Haryana, and is continuing to closely monitor the development of the domestic carbon trading scheme of the national carbon market in India.
CLP has not adopted an internal price on carbon, as this is not foreseen as being strategic for the Group to accelerate its decarbonisation journey. As outlined under CLP’s Climate Vision 2050, clear targets have been set that help shape current and future investment decisions. As part of this commitment, the Company is strictly focused on expanding its portfolio of renewable and non-carbon assets, coupled with an increasing focus on transmission and distribution as well as new business opportunities presented by the Group’s innovation team. An internal price on carbon would not impact or change the Company’s investment decisions.
For the existing portfolio of thermal assets, as outlined above, CLP is tracking the development of domestic and international carbon markets and is making appropriate provisions to prepare for this eventuality. More importantly, the company’s thermal assets are already slated to be phased out from the portfolio, and adding an additional complexity of an internal carbon price would not accelerate this decarbonisation trajectory.
Climate resilience
Extreme weather events are perhaps the most visible and imminent risk that arises from climate change. Recent years have seen many high-impact events including typhoons, floods or droughts, heatwaves and bushfires around the world. These events can cause physical damage to CLP’s assets and operational disruption, which in turn, can result in reduced output, increased repair and maintenance costs, and service disruptions for customers. It is critical that CLP’s systems are resilient enough to withstand extreme conditions to minimise disruption and to help facilitate faster recovery for affected communities.
Aside from direct physical damage, climate change can also adversely impact the company’s operations in other ways. For instance, shifts in rainfall and drought patterns may reduce the availability of raw water for some power plants. Damage to assets along the supply chain, in particular the procurement of fuel, is another way that extreme weather events may affect the Group’s ability to reliably deliver electricity.
In response, CLP has put in place adaptation or mitigation measures appropriate for each of its markets. These are summarised below.
Asset management
Strategies and procedures
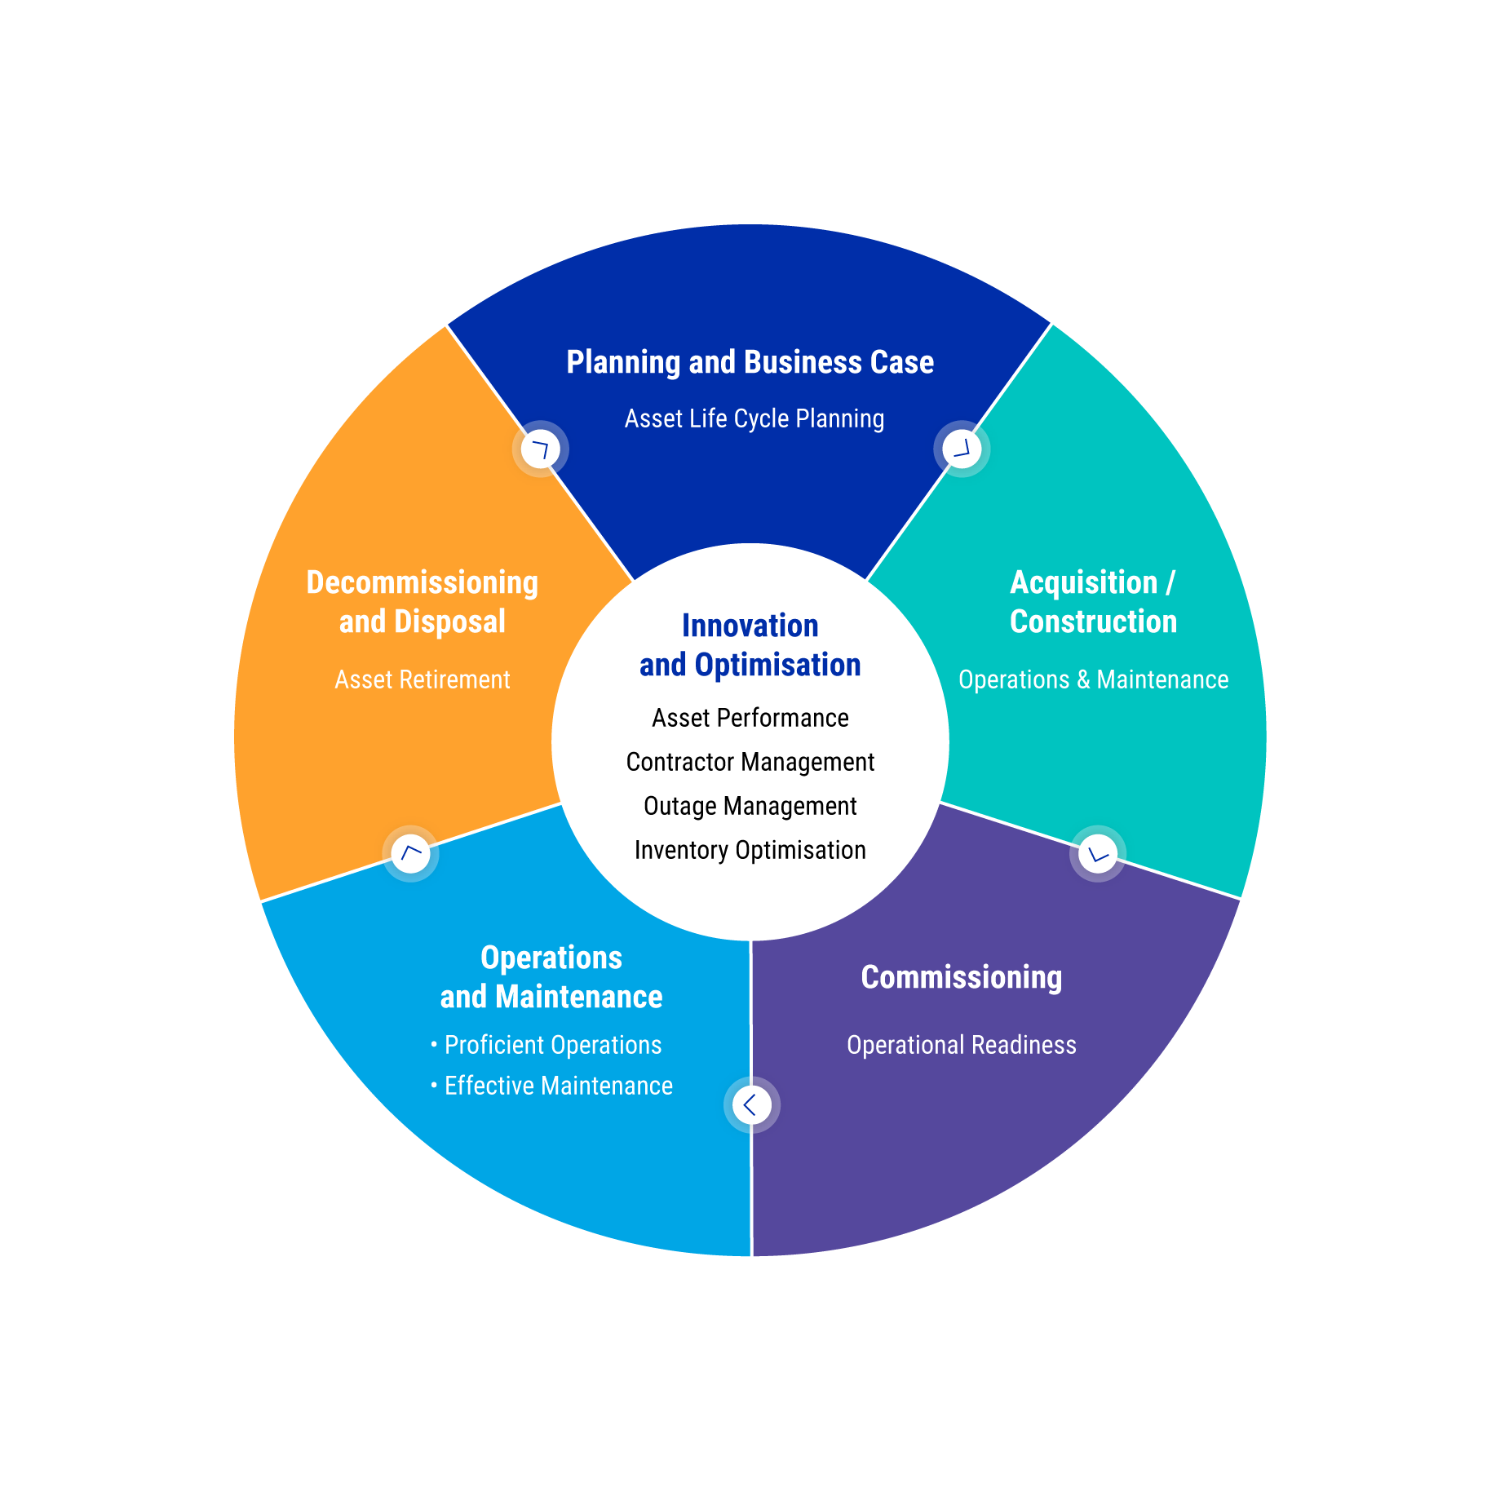
CLP’s Asset Management System (AMS) Standard was developed in 2016 to standardise key practices in asset management across the Group. It sets out a framework to ensure best practice is followed based on the ISO 55000 series of standards for asset management as well as the ISO 31000 standards for risk management.
The AMS Standard is integrated into CLP’s Health, Safety, Security and Environment (HSSE) Management System and the Project Management Governance System (PMGS) Standards to manage the complete lifecycle of an asset. The AMS contains five key stages and ten asset management elements, as illustrated in the diagram below.
Monitoring and follow-up
CLP has developed and implemented a non-financial data reporting and assurance standard in-house. Relevant staff at asset, regional and Group level are expected to take responsibility for upholding the standard. The customised Group Operations Information System (GOIS ) is used to compile operational data. It facilitates data collection and approval and reduces the chance of human error.
Continuous improvement
CLP constantly identifies opportunities to improve the operational efficiency of all Group assets, which help meet the increasingly stringent regulations on emissions and fuel efficiency in certain jurisdictions.
Initial efforts at the project planning stage are critical in determining the operational efficiency or capacity factor range of an asset through its entire lifespan. Projects involving a major asset overhaul require stringent technical and financial scrutiny before commencement.
Opportunities arising from innovation and optimisation, particularly from big data and data analytics are also increasing, with a wide range of potential applications including performance enhancement. Find out more here.
Overview of CLP’s asset management
Generation assets
The decrease in coal consumption was primarily due to the decreased output from Mt. Piper in Australia, Jhajjar in India and Castle Peak in Hong Kong. The increase in gas consumption was mainly due to increased production at Tallawarra in Australia and Black Point in Hong Kong.
Examples of operational efficiency improvement projects at CLP Group assets can be found here:
Find out how innovation improves CLP Group's operational performanceCLP reports the annual operating performance of its generation portfolio for those assets which fall within the reporting scope. The performance metrics include the availability factor, generation sent-out, thermal efficiency and energy intensity.
Download CLP’s asset performance statisticsTransmission network
To meet Hong Kong’s electricity demand growth, CLP reviews future transmission network developments annually in accordance with the latest system maximum demand forecast, area load growth, infrastructure development and generation development. Maintenance and improvement programmes have been developed annually for major assets, based on the analysis of current conditions and performance of assets, level of investment and risk.
CLP continues to improve the reliability of its power supply network. In addition to vegetation management and third-party damage prevention programmes, various measures are taken to further enhance network reliability and minimise customer supply interruption. Examples include:
Installing on-line condition monitoring systems for switchgear and transformers to allow real-time monitoring and detection of incipient fault conditions
Continuing the reinforcement of towers for 400kV overhead lines against super typhoons and the refurbishment of switchgear
Enhancing automatic detection and isolation of faulty sections of overhead line circuits and expediting deployment of smart meters in villages
Conducting regular reviews and targeted studies on network performance to drive continual improvement.
Making clean energy accessible in India
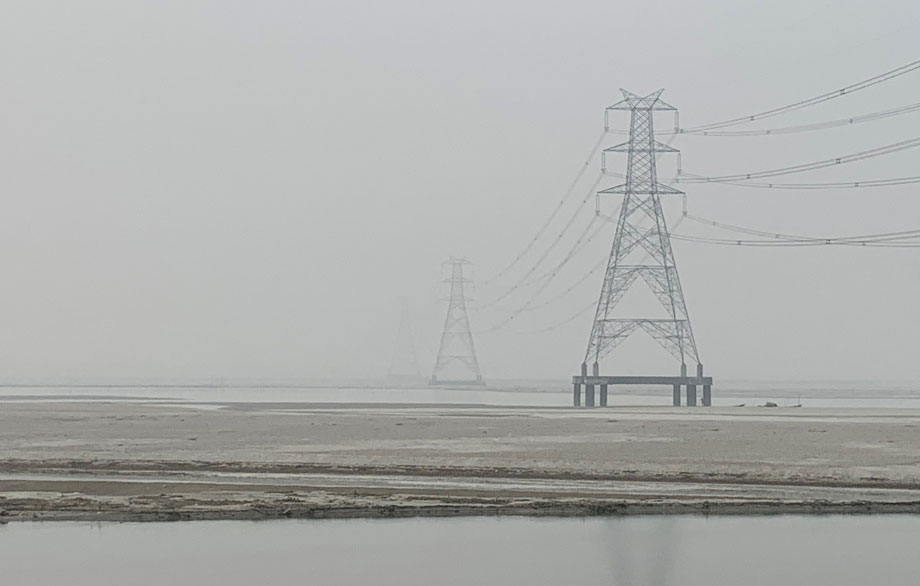
CLP India successfully entered into the transmission sector in 2019.
CLP India has taken action to make low carbon and clean energy accessible through infrastructure development and investment in the transmission sector.
CLP India entered into an agreement with Kalpataru Power Transmission Ltd. to acquire three of its power transmission assets in 2019. One of the three projects, Kalpataru Satpura Transco Pvt. Ltd. (KSTPL), was successfully transferred to CLP India in November 2019, marking the company’s entry into the transmission sector. Procedures and guidelines in line with CLP Group standards are being implemented to ensure enhanced operational practices and improved safety standards in the newly acquired transmission assets. CLP India will continue to explore opportunities to expand its transmission portfolio in the coming years.
Pursuing opportunities in Mainland China
The Mainland China Government has been restructuring the energy market through regulatory changes and the introduction of more competition. CLP is actively pursuing opportunities from marketisation and smart energy development in Mainland China.
Through TUS-CLP Smart Energy Technology Co. Ltd. (TUS-CLP), CLP’s joint venture with TUS-Holdings which is affiliated to Tsinghua University, CLP participates to build and operate an incremental distribution network (IDN) at the Fangchenggang High-Tech Zone. This project is CLP’s first investment in distribution grids in Mainland China and will set a solid foundation to expand into similar opportunities in southern China as reform of the electricity sector continues.
The Outline Development Plan for the Greater Bay Area released by the Central Government in 2019 makes the development of smart cities in the region a key focus. In response, CLP has set up a dedicated team to work closely with partners to pursue opportunities in this important emerging sector, with smart energy development a priority. CLP’s active participation will contribute to sustainable business growth and to the long-term development of the electricity sector in Mainland China.
Availability and reliability
Goals and targets
Targets for each asset are set annually and included in the business plan. Performance is reported on a weekly basis to senior management. Any significant variations to plans are analysed and corrective action is taken where appropriate.
For generation assets, CLP monitors the availability factor – defined as the amount of time that an asset is able to produce full load equivalent electricity over a certain period, divided by the amount of time in that period. Typical values range from 70-90%.
Strategies and procedures
While CLP has generation businesses across the Asia-Pacific region, Hong Kong is the only location where the business is vertically integrated, including a transmission and distribution network. CLP Power Hong Kong is regulated by the Hong Kong Government under a Scheme of Control Agreement (SCA) framework that requires the company to forecast electricity demand and plan for investment to provide a safe and reliable electricity supply to customers. In Hong Kong, CLP uses various measures to maintain high supply availability and reliability. These measures include:
Maintaining sufficient generating capacity to meet forecast demand as well as planned and unforeseen outages
Implementing demand side management measures to reduce demand growth and to improve utilisation of existing assets
Upgrading generation and network facilities to meet new electricity demand
Adopting advanced technology such as smart grid
Improving the quality of the power supply to minimise voltage dips
Enhancing power systems to minimise the impact of adverse weather.
CLP promotes organisational learning and the building of technological capacities across the Group, and insights learned from regional experiences are shared amongst functions to plan for a consistent management framework. This practice facilitates better portfolio management, as well as reducing risks to the Group’s operations as a whole.
On a three-year rolling basis, i.e. over 2017 and 2019, a CLP Power customer experienced 10.1 minutes of unplanned power interruptions per year. This was due to the impact of super typhoon Mangkhut in September 2018. Excluding that, the performance would have achieved a three-year rolling average of about 1.3 minutes. This achievement shows the value of a stable and supportive regulatory framework that encourages careful investment planning, as well as the professional expertise of employees in power operations.
CLP’s transmission and distribution network in Hong Kong serves about 80% of the population of the city and close to 100% of the population in the company’s service area. At the end of 2019, CLP Power had approximately 1,149 km of overhead and approximately 14,881 km of underground circuits at medium or higher voltage. In addition, there were 232 primary and 14,867 secondary substations in Hong Kong. In 2019, the average network loss for the past five years was 3.83%, slightly lower than the 2018 figure of 3.94%.
In 2019, CLP continued to enhance the reliability and security of the supply system and invested around HK$9.1 billion to meet both current and future energy demand. A set of universally recognised supply reliability performance indicators are used from the IEEE 1366-2012 standard to monitor system performance. These indicators are reported annually to the Hong Kong Government.
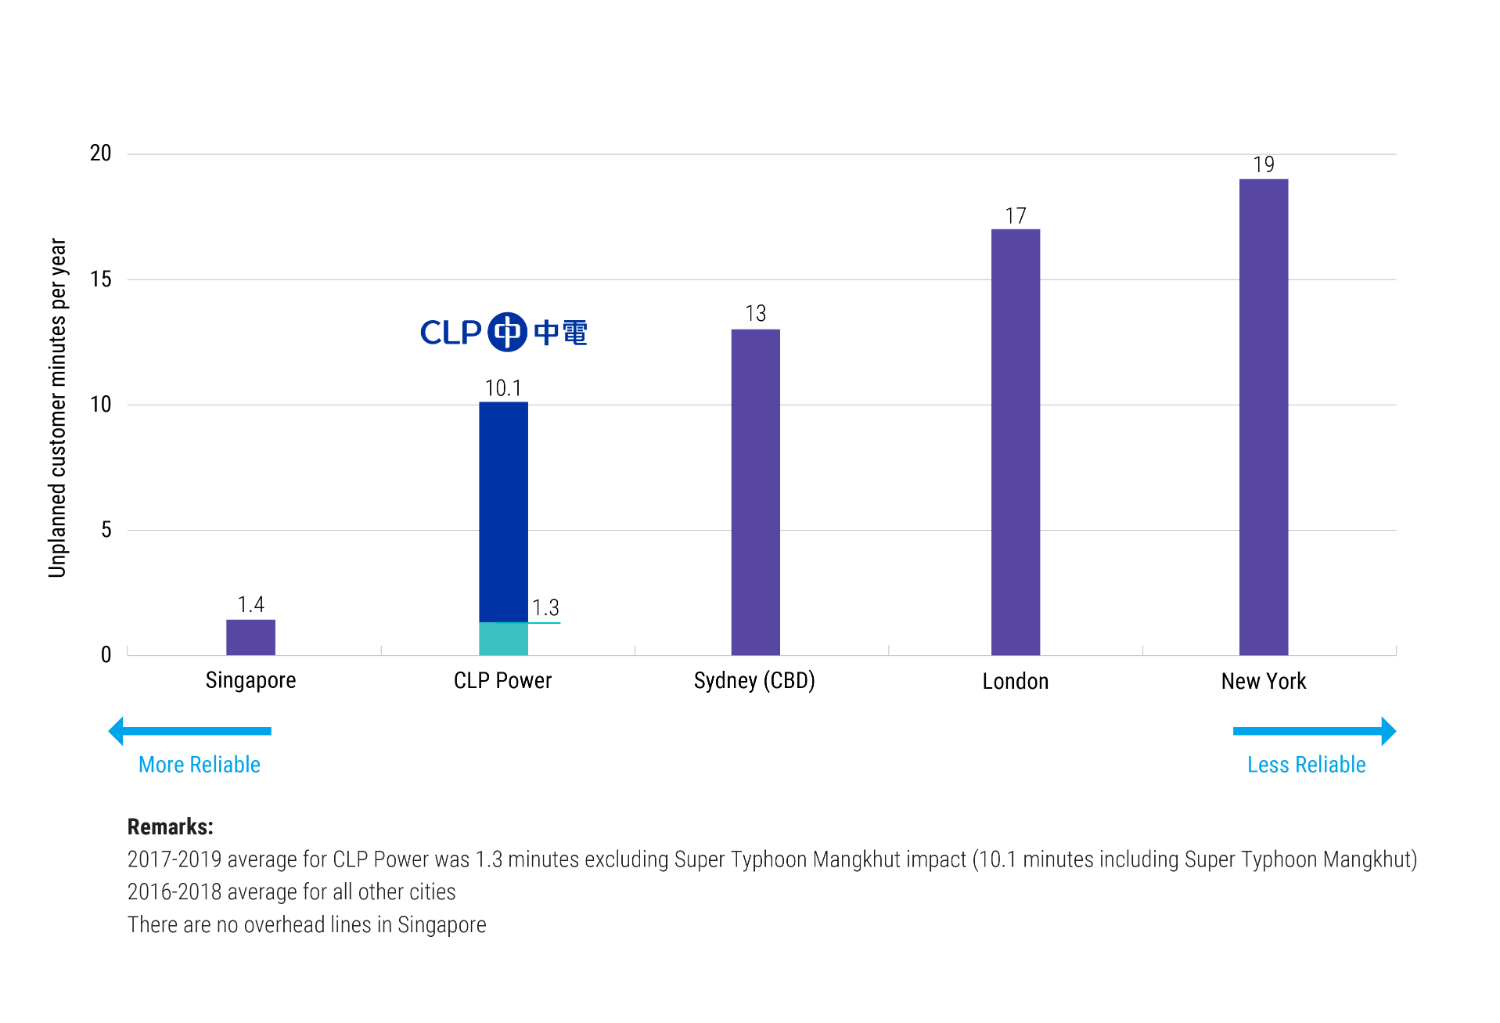
Security and cyber security
Goals and targets
CLP’s security management process evaluates, in a systematic and risk-orientated way, the security status of any asset operated and owned by CLP. This enables the company to continuously evaluate its security processes and enhance them according to the perceived threat and vulnerability of any given site.
Strategies and procedures
CLP’s approach to security can be best understood using the diagram on this page. There are five separate but co-dependent lines of activity, all of which are protected (to a lesser or greater extent) by cyber and physical security measures. These lines of activity are:
Information: data is stored in both hard and electronic formats, and the confidentiality, integrity and availability of this data needs to be protected
Operational Technology (OT): hardware and software that detects, monitors or controls physical devices (such as a turbine) at CLP assets
Information Technology (IT): the use of computers to store, retrieve, transmit, and manipulate data or information
Personnel: Staff employed by CLP
Brand: CLP’s image, identity and associated reputation.
All these lines of activity are influenced by cyber security, particularly IT, OT and information. They are therefore protected by appropriate cyber security measures and supported by robust and scalable physical security measures. Taken together, they provide comprehensive, layered and flexible protection.
CLP's approach to security
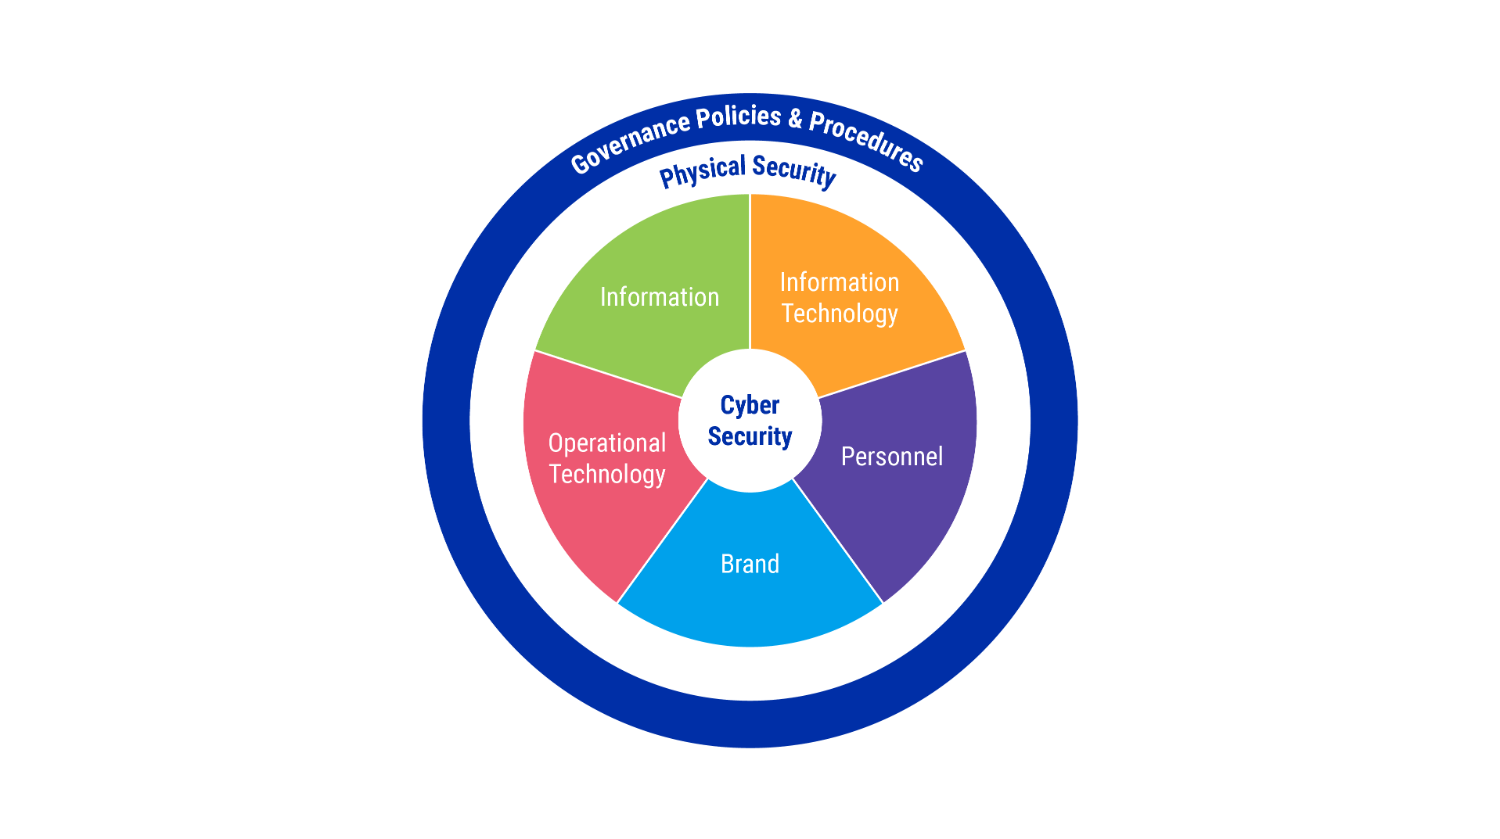
Training and awareness
CLP security staff have a key role in preventing harm to staff and the wider public. Standards of conduct are informed by the Value Framework and Security Management System, which requires each CLP region and their sites to develop an appropriate security system to effectively address the threats faced. All in-house security staff are required to comply with CLP’s Code of Conduct on an annual basis. In addition to national regulations and site-specific briefings, third-party vendor security staff receive training on CLP’s harassment-free policy, guidance on minimum wage policy and other non-discrimination training during their induction. Their training must be completed before personnel are granted access to their assigned workplace sites.
Cultivating a secure cyber environment
Ensuring a secure cyber environment is essential in safeguarding CLP Group operations and assets.
Cyber attacks previously focused on obtaining commercially sensitive information. Today, attacks on operations pose serious threats and could create significant financial damage and potentially threaten lives. Therefore, security of both IT and OT are equally important.
The figure below summarises the security focus of CLP’s IT and OT systems. Based on the ISO/IEC27002:2013 framework, a set of Group-level policies have been developed, based on which regional standards and procedures are developed so that they are suited to the context and local regulation of corresponding business units.
Cyber security incident response
The CLP Group remains vigilant in being prepared for a cyber-induced crisis. CLP monitors alerts from its information technology and operational systems and provides continuous upskilling and training for staff to equip them with the skills required to identify and detect anomalies.
The Cyber Security Incident Response Process was developed to:
Define a consistent response protocol upon detection of cyber incidents
Provide a detailed process flow showing the interactions between different virtual teams that are likely to be involved in the response
Define the roles and responsibilities for the virtual teams along with the incident escalation to the Emergency Control Team or the Emergency Management Team as needed.
Processes are regularly reviewed and rehearsed through drills. These firm up the incident response capabilities, improving cyber crisis management, and prepare executives to lead in cyber crisis situations. Ultimately the goal is to restore operations and services as soon as possible.
Cyber Security Incident Response Process
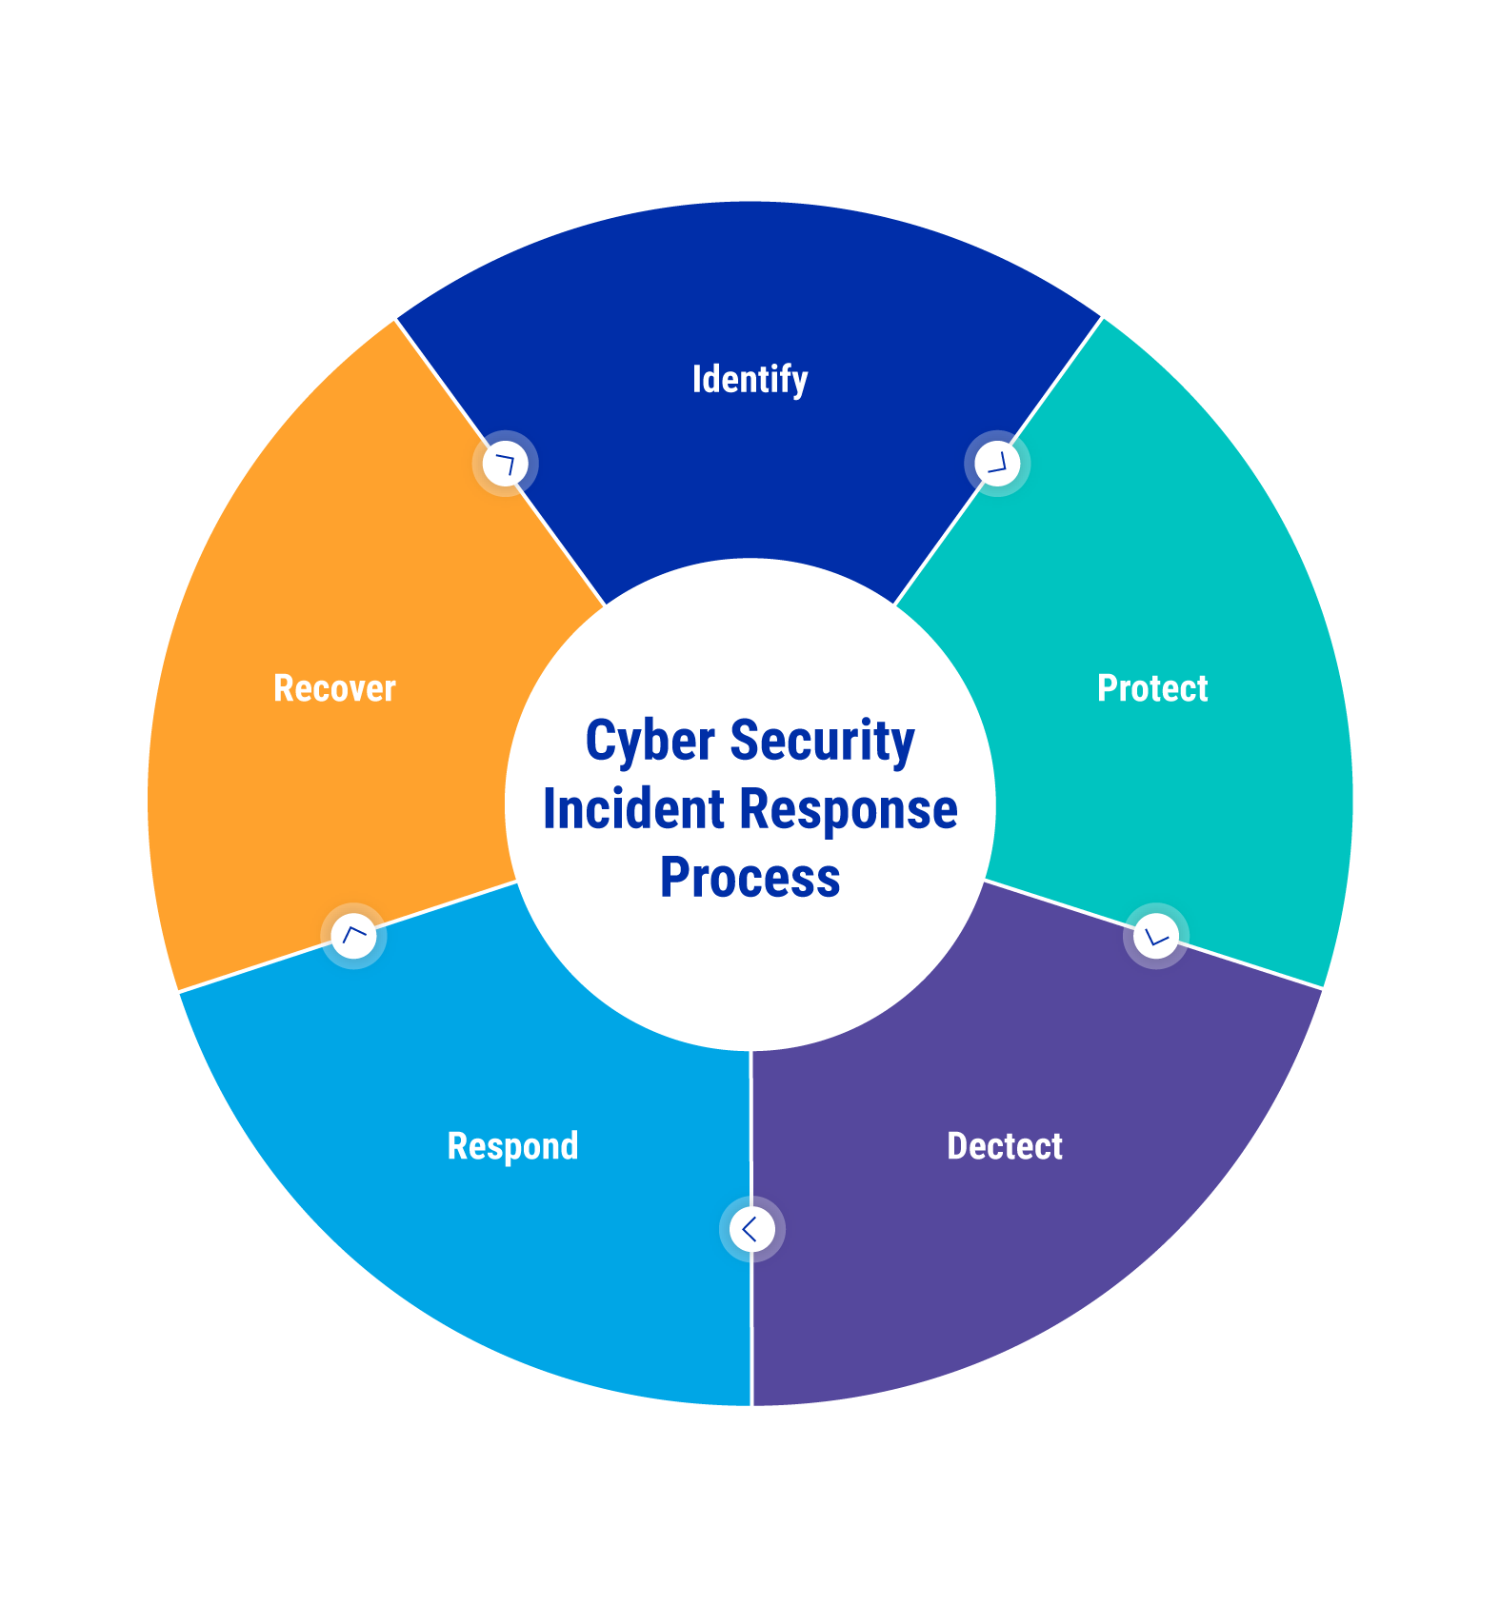
Summary of the security focus of IT and OT systems
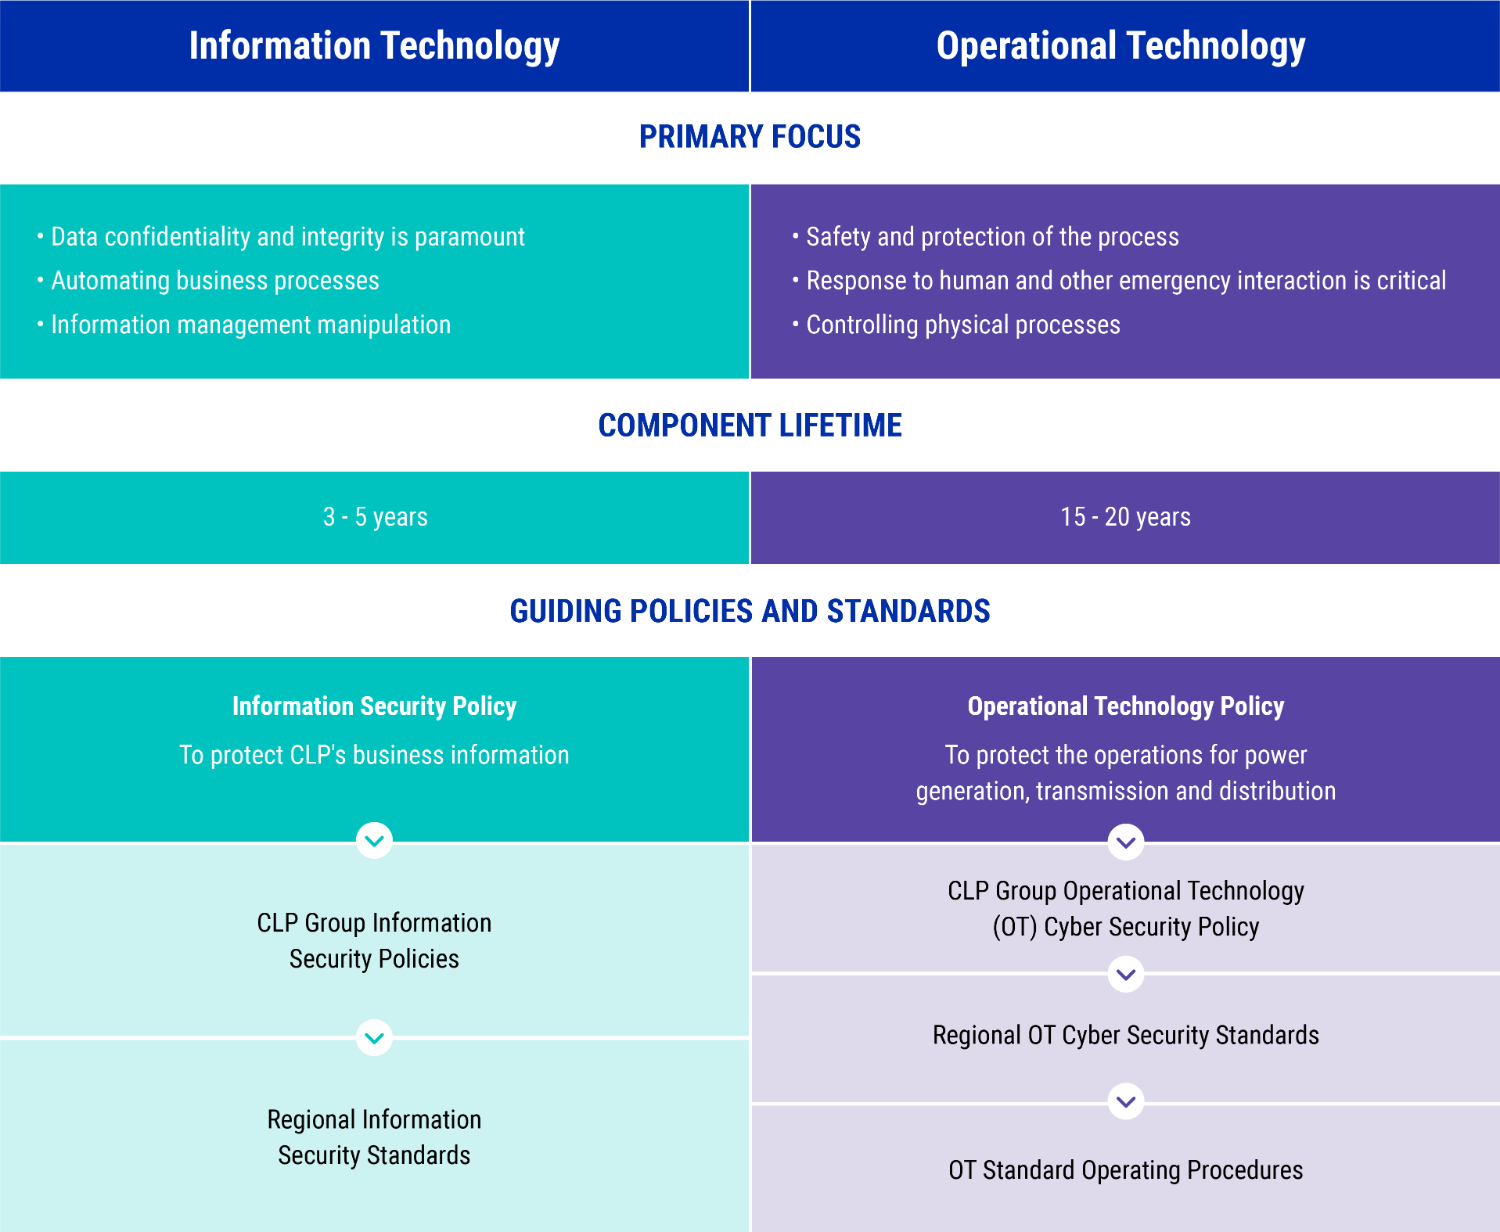
Emergency and crisis management
CLP’s Crisis Management & Emergency Response Structure is outlined in the diagram below. The Group Crisis Management Plan provides a platform for the effective handling of a crisis at the CLP Group level by:
Outlining crisis management organisation, roles, responsibilities, procedures and processes
Specifying the tools needed to ensure the collective response is well planned, well executed, and fully integrated across the organisation;
Describing the relationship and interface between the handling of regional- and Group-level crises
Detailing the processes that govern internal and external communications during emergencies and crises; this ensures the people responsible for managing a crisis have the necessary information to carry out their responsibilities and that key stakeholders are informed.
The Group-level plan is supported at regional level by Regional Crisis Management Plans which mirror the Group document but are tailored for each region. In addition, detailed emergency response plans have been developed for each asset. These plans are designed to be used by first responders and asset managers.
CLP Crisis Management & Emergency Response Structure
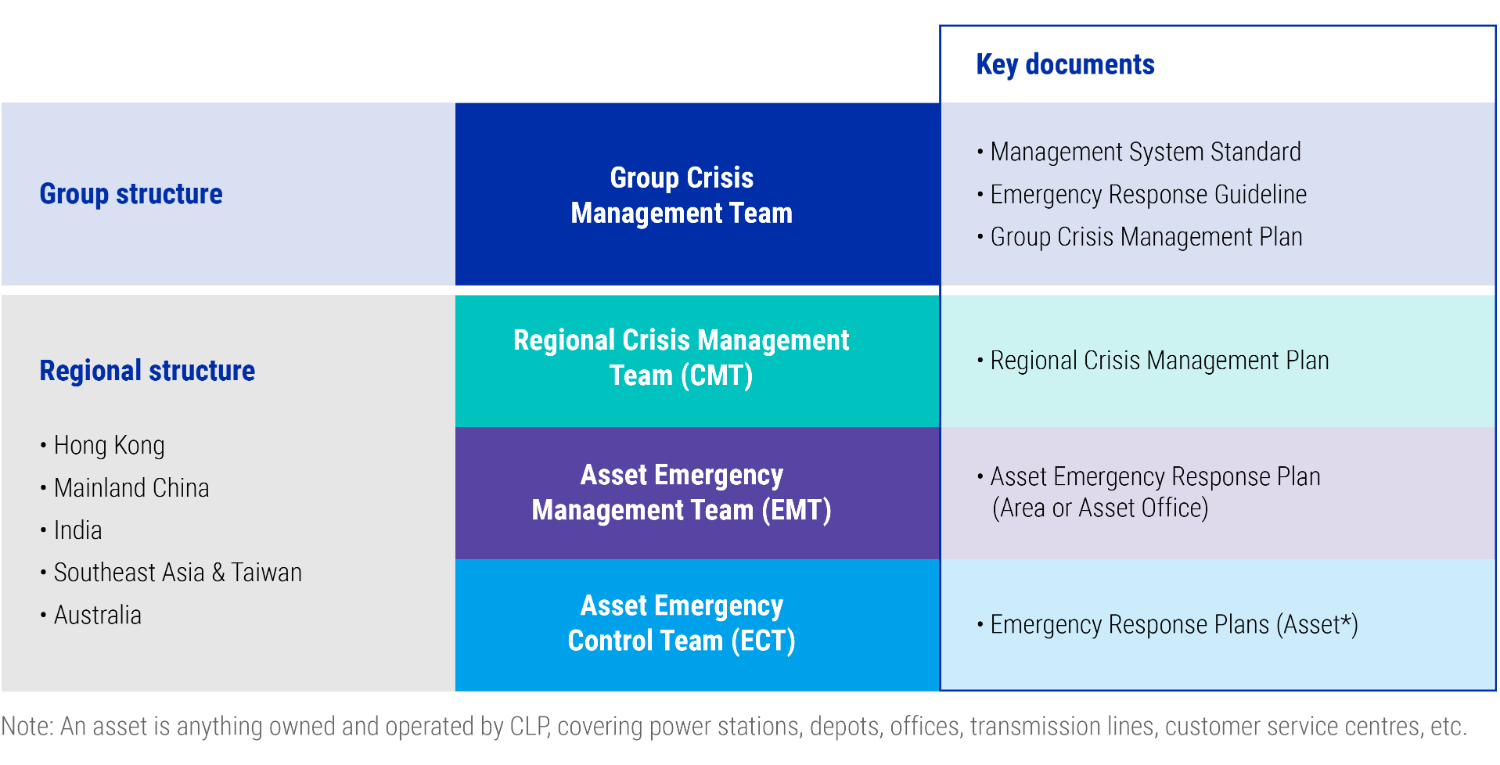
Training and awareness
As specified in both Group and regional publications, emergency response drills are conducted at least annually at all Group sites, with smaller scale drills taking place more often. Group and Regional Crisis Management plans are reviewed every three years or fewer. Regional crisis management exercises are conducted annually as part of the internal peer review process.
Travel security
As the CLP Group’s operational footprint expands, so does the frequency and range of business travel for staff members. Protocols and procedures are in place to adequately prepare staff before travel, support them when they are on the road and to respond quickly in the event of a travel emergency anywhere in the world. In view of emerging risks, information packs are updated regularly to help employees prepare for business trips.
At the Group level, communications and administrative drills have been conducted quarterly to ensure that the equipment and procedures are functional and fully understood by the operators.
In terms of business travel, training sessions for supporting staff and for the business travellers themselves continues to be provided on a quarterly basis, to ensure higher levels of understanding and awareness. The unprecedented protest situation in Hong Kong has led to the provision of regular (twice a week minimum) updates to all staff and the development of an information pack for business travellers coming into Hong Kong.
Response to COVID-19
The Novel Coronavirus (COVID-19) emerged from the City of Wuhan, Hubei province of Mainland China in late 2019 and began to be monitored closely as it became an epidemic.
In line with the response from the Hong Kong Government, CLP raised its readiness posture, first to “Alert” and then to “Emergency” and implemented its Infectious Diseases Response Plan (HSSEQ-ITN-016) which deploys graduated response measures in order to best protect staff operating in an affected area. At the time of writing, these measures are ongoing and include, amongst others, work from home (WFH), restrictions on assembly, self-quarantine and reporting, reduction on business travel and the provision of endorsed health and hygiene advice. The key lies with regular and trusted communication which is timely and proportionate, proposing sensible measures and knowledge which impart confidence to the staff.
Stakeholder Engagement Framework
GRI reference: 102-43 , 102-44
CLP’s Stakeholder Engagement Framework includes the following steps:
Aligning engagement objectives with business objectives
Mapping issues and concerns
Identifying relevant stakeholders
Developing a communications and engagement plan
Conducting the engagement activities
Capturing feedback and reporting on outcomes.
The effectiveness of CLP’s approach to stakeholder engagement is captured through a number of measures, which include: stakeholder feedback, outcomes following engagement, positive and/or negative news about the company, brand perception ratings, and recognition and awards.
Strategies and procedures
GRI reference: 102-40, 102-42, 102-44
The CLP Group’s business activities involve a diverse range of stakeholders. For each project, key stakeholder groups are identified and prioritised based on how they will be impacted, and their influence on the success of the business. CLP has a wide range of easily accessible public engagement channels to enable it to receive concerns, interest or feedback at any time during the year.
The table below summarises key stakeholders and how they are engaged:
CLP’s Stakeholder Engagement Framework
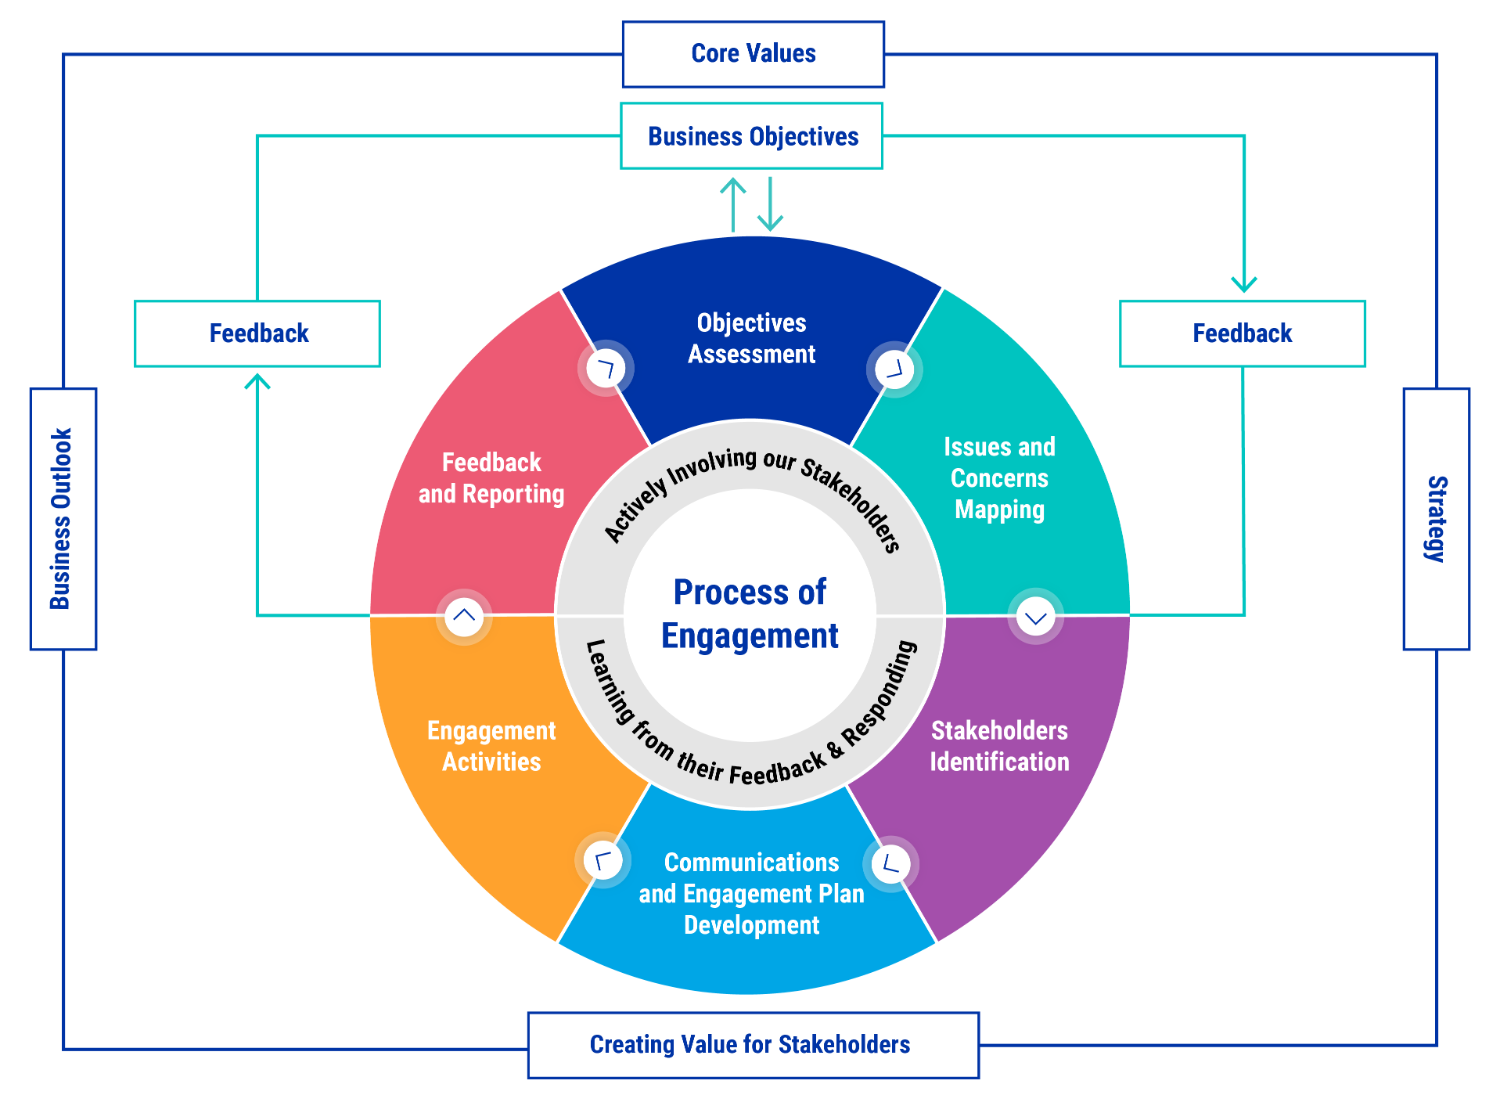
The CLP Group is committed to responding to stakeholders’ concerns about the business in a timely manner. These concerns vary depending on the location and context and therefore require different actions or responses. General complaints about the company are typically handled by the Public Affairs team who work with the relevant business units to resolve issues at hand.
Lenders, investors and shareholders
Governments and regulators
Suppliers and contractors
Employees
Residential, commercial and industrial customers, electricity boards, grid companies
Legislators, academia, community groups, NGOs, industry and professional organisations
Public policy
GRI 415-1 Political contributions
CLP’s policy is to remain politically neutral and to avoid making political contributions. For public policy developments which apply to the electric utility industry, the Group develops carefully considered positions and seeks to provide input to support the decision-making process. By bringing its industry expertise to the table, CLP can add value to the discussion on how best to structure rules for the energy industry going forward, as both technology and public demand evolves.
Download CLP's Policy on Making Political ContributionsCLP’s responses to public policy consultations – in addition to its Group-wide positions on critical issues such as climate change – are published and accessible on company websites or relevant government websites. For example:
CLP Power Hong Kong’s responses to the consultations on the long-term decarbonisation strategy for Hong Kong, future development of the electricity market and the future fuel mix for electricity generation in past years are available here.
CLP Group’s response to consultations in relation to corporate governance and ESG matters in the Hong Kong market can be found here.
EnergyAustralia worked with industry to consult with the Australian Government on the National Energy Guarantee (NEG), discussing how the company could best balance the transition to clean energy and maintain reliability in the energy system. That submission can be found here.
None of the CLP Group companies in Hong Kong receive any significant financial assistance from the government outside of those financial incentives or subsidies which are in place to encourage market participants to behave in certain ways. Examples of such incentives include tax holidays and preferential tariffs for renewable investment or financial assistance from export credit agencies.
CLP supports and actively participates in a range of organisations to enable the Company to keep abreast of different stakeholders’ views and to shape informed policy making. Contributing to policy position papers helps CLP navigate policy uncertainty and respond accordingly.
The table below outlines the total amount CLP has contributed to organisations which seek to influence public policy.
Community Investment
CLP is committed to contributing to programmes which support healthy, resilient and sustainable development over the short- and long-term. In line with the CLP Group Community Initiatives, Sponsorship and Donation Policy on community engagement, the aim is to:
Support projects or programmes that reflect the needs and expectations of local communities and are sensitive to prevailing cultures, traditions and values
Provide support to projects or programmes that are systematically managed with clearly-identified objectives and expected outcomes
Engage in long-term partnerships with credible international, national, regional and local community organisations, non-governmental organisations and charities
Support projects or programmes that offer the opportunity for employees to be involved
Regularly evaluate contributions as well as their outcomes and impacts.
Strategies and procedures
CLP’s community initiatives focus on four pillars: Environment, Education and Development, Community Wellbeing, as well as Arts and Culture. These focus areas cover many of the social issues faced by the communities in which the Group operates.
Monitoring and follow-up
CLP has benchmarked different socio-economic impact measurement tools to better evaluate the social impact of its community initiatives. The company has applied the most suitable means to review the effectiveness of its community contributions.
For example, CLP India commissioned the Gujarat Institute of Development Research to assess the effectiveness and impact of selected educational and skill development programmes including Informal Education Evening Classes, the CLP India Scholarship Scheme, Financial Support Programme and Computer Literacy Programme. The study confirmed that these programmes have a positive impact on the enrolment and retention of children in schools, as well as enhancing the overall quality of life for the people living in the villages.
CLP has a standardised online reporting system for reviewing and reporting its community initiatives. The system is designed to enhance the overall effectiveness and efficiency of these initiatives by aggregating data on themes, partners, spending, beneficiaries, volunteer hours and impacts.
CLP’s Community Initiative Approach
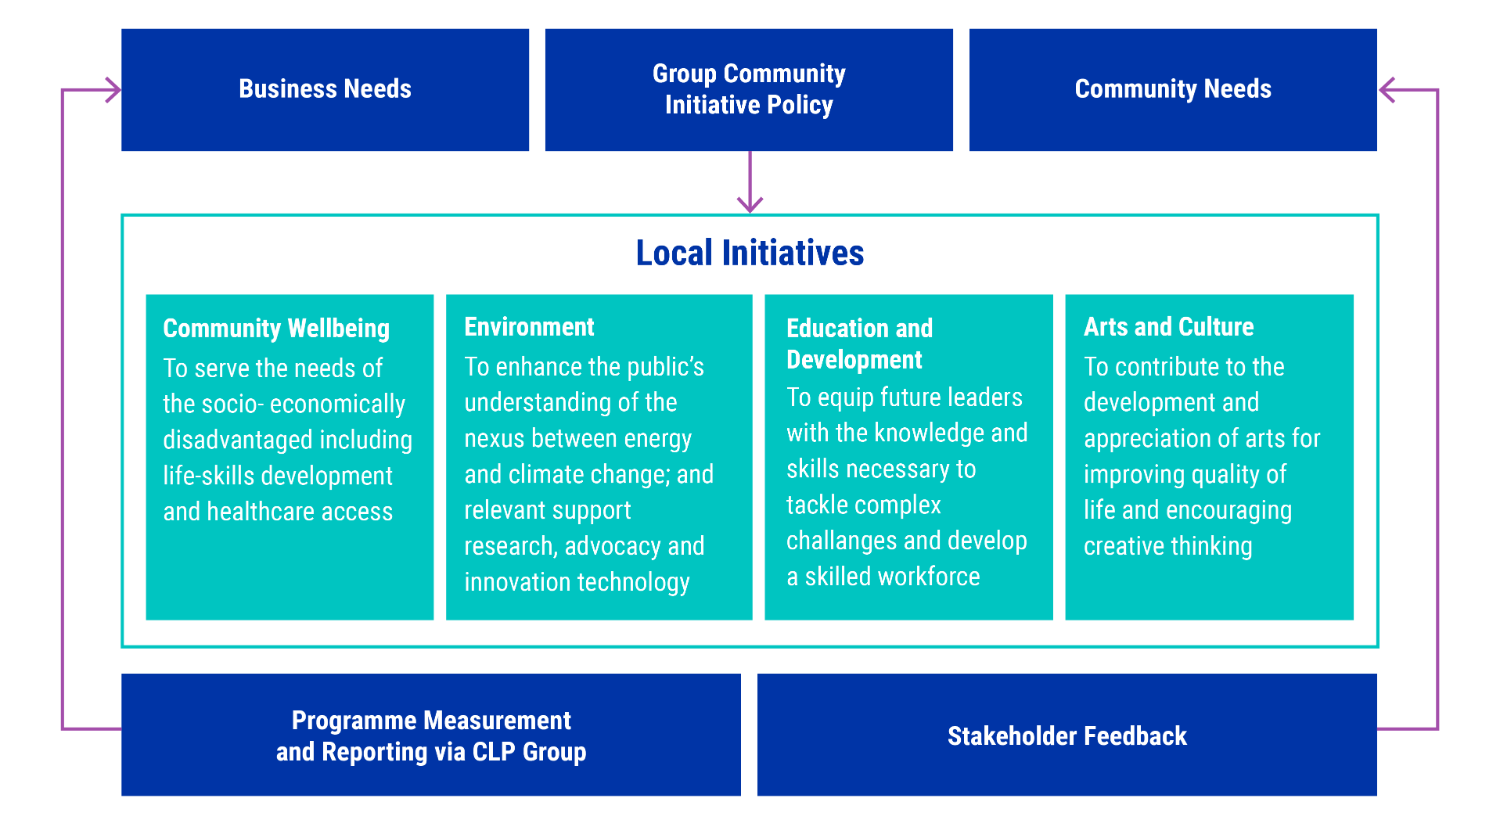
Employee volunteering exemplifies the Company’s ties to its communities. Across the different markets, CLP employees devoted their time and expertise in voluntary projects in their communities. The year 2019 marked the 25th anniversary of the CLP Volunteer Team in Hong Kong. In December 2019, CLP Power Hong Kong received the gold award in the volunteer team category of the 10th Hong Kong Outstanding Corporate Citizenship Awards.
Read personal stories of CLP VolunteersEnergyAustralia’s volunteering programme is an important way through which employees connect with their communities, building a genuine understanding of local social issues. In 2019 a focus on increasing the number of volunteering opportunities, as well as new types of opportunities allowed the teams in call centres and power stations to participate more easily. This resulted in an increase of volunteering hours to 5,500 hours in 2019, but importantly also provided the charity partners with an increased number of volunteers through which they could deliver services to their customers.
The introduction of the Workplace Giving programme in 2018 was strongly supported by the Board and Executive Management, who continue to donate 1% of their salaries to the charity partners. In 2019, the strong leadership support and innovative launch campaign saw EnergyAustralia awarded "Best Refresh/Launch" in the Employer category of the Workplace Giving Excellence Awards. Over AUD $377,000 was donated to the Company's charity partners through the programme in 2019.
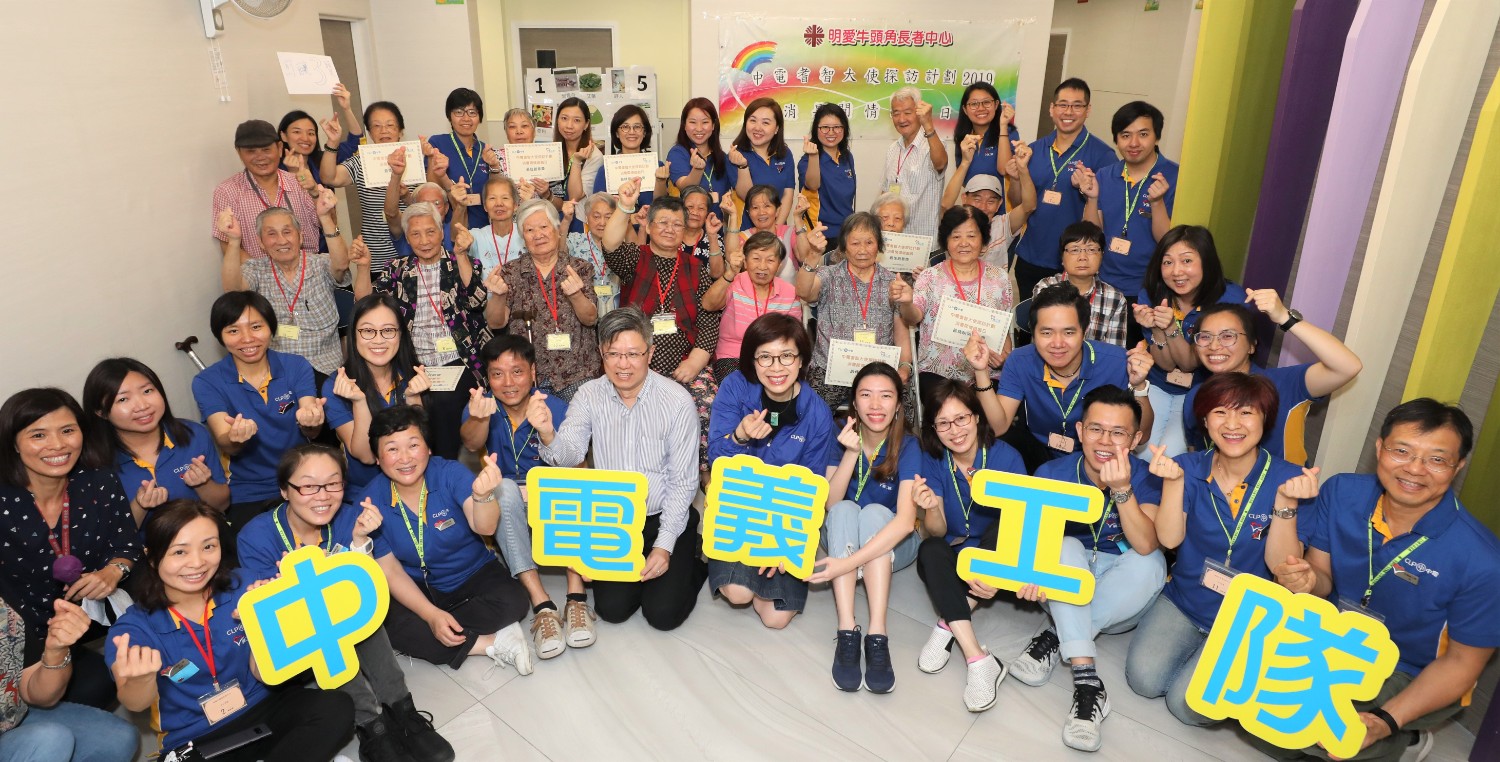
The CLP Volunteer Team in Hong Kong has been set up for 25 years.
Community spending by theme and geography are summarised in the charts below.
CLP Group programmes benefitted 615,000+ people in 2019, compared to 730,000+ in 2018. In 2019, Education and Development accounted for the majority of direct beneficiaries across all community initiatives (63%).
Education continues to be a key focus as it is the most powerful investment in building a just and prosperous society. CLP community programmes engage with young people at all stages of their educational journey in the communities the company serves, to create value through CLP’s expertise and networks to help young people advance their careers and achieve upward mobility.
In partnership with the Hong Kong Federation of Youth Groups, CLP Power organised the CLP Energy for Brighter Tomorrows Award for the second year and offered 20 scholarships to secondary students in Hong Kong who have overcome adversity in life and shown a positive life attitude. The awardees are matched with CLP engineers in a one-year mentorship programme which provides them with support and guidance. Information on the programme can be found here.
Financial counselling development initiatives to ease financial hardship
A growing need for financial counselling services from the Australian community has placed pressure on an insufficient number of qualified professionals, who have few career progression opportunities.
In 2018, EnergyAustralia identified an opportunity to support the industry by investing AUD $1.2 million into a three-year financial counselling development programme. The initiative aims to establish a wide-ranging training and professional development plan for the sector, creating a community of people who bring financial professionalism and skills to their workplace, ultimately helping those in the community who are experiencing financial hardship.
Outcomes of the investment include the development and delivery of an educator scholarship programme, a Diploma of Financial Counselling scholarship programme, an accredited Professional Supervision/Mentor scholarship programme and an Advanced Diploma of Financial Counselling scholarship programme for participating states. Partnering with ICAN Learn and state peak financial counselling associations, the programme provides educational opportunities for experienced financial counsellors to add training delivery, supervision, casework specialisation and leadership to their skill sets, generating new career prospects.
In 2019, 85 students were granted scholarships under the initiative to begin their journey into financial counselling and twelve students have already completed their Diploma of Financial Counselling. 25 financial counsellors completed the Professional Supervision/Mentor programme.

EnergyAustralia in partnership with ICAN Learn funded 12 students in Central Victoria to complete their Diploma of Financial Counselling.
A milk cooperative initiative empowers 1,500 women

The milk cooperative women self-help groups’ gathering in Jamoniya Village, near CLP India’s Chandgarh wind project site.
In the Tonkkhurd Block of Dewas (Madhya Pradesh) equal opportunity for women is a distant dream. CLP India introduced Project Uday in 2017 to empower women with an opportunity for an alternative livelihood.
A survey across 18 villages revealed that dairy farming and animal caring were the most suitable alternatives for women. CLP India helped 1,500 women through more than 120 Self-Help Groups in those villages – all linked with local banks to secure future credit support.
The project is co-funded with OEM partner Siemens Gamesa on a 50% basis. CLP India co-crafted this project with an OEM partner in Chandgarh. CLP India believes that working jointly with the OEM partner will create a more impactful programme, compared to having numerous initiatives in the same catchment.
Milk Collection Centres (MCC) started in 14 villages, through which women offer quality milk at fair prices. Today, 120 litres of milk are supplied daily, and approximately more than 600 litres are collected from 14 MCCs, providing employment to around 40 villagers. While this initiative has provided women with leadership opportunities, it has also been instrumental in broadening the mindset in communities. Women now use their income more wisely, particularly in spending on healthcare and children’s education. A recent International Women’s Day celebration saw 2,000 women from 18 villages where the Milk Federation team showcased their work to government officials and financial institutions. The government officials also committed to provide more benefits from government schemes. After the success of Phase I, Phase II commenced in September 2019 for three years, with CLP India targeting more beneficiaries. It is expected that more milk selling outlets will be started soon. Milk processing units and logistics will be formalised with a focus on branding and marketing to ensure sustainability in business practice.
Talent and skills for the future
In order to manage this transition, pursue regional growth and address the demographic and labour market challenges of an ageing workforce and competition for STEM-qualified individuals, CLP must find ways to attract and retain a more gender- and culturally-diverse, multi-generational workforce and to share talent effectively across the portfolio of businesses.
Standards and procedures
CLP has a comprehensive training and development framework in place to deliver a wide range of training and development programmes to help people to perform competently in their current roles and prepare them for future business challenges and opportunities, including programmes for all employees and for contractors, where appropriate.
On-going technical and safety training is provided to develop the technical competencies required and ensure safety is a top priority. Strategic, general management and functional management programmes are used to help build future leaders. Training and development programmes are delivered internally (in Hong Kong, through the CLP Power Learning Institute) and in partnership with leading academic institutions including the International Institute for Management Development (IMD), the Ivey Business School, Tsinghua School of Economics and Management, Chatham House and the École Polytechnique Fédérale de Lausanne (EPFL). Expert briefings, workshops and online programmes are conducted on the latest global economic, political and technological trends.
CLP’s performance management system provides the basis for identifying individual development needs and company-supported education policies support employee-initiated self-development. CLP recruits externally for critical roles, focused on innovation, digital and renewables capabilities.
Monitoring and follow-up
CLP conducts regular talent and capability reviews, focused on both general management and engineering streams. The reviews monitor and follow up actions to address current and future gaps and opportunities, including the progress of development programmes, recruitment campaigns, initiatives to strengthen gender diversity and cross-business assignments. The effectiveness of this approach is measured by a range of key internal performance indicators including retention of key talent, turnover, gender and ethnic diversity and engagement measures. The Board Human Resources & Remuneration Committee reviews talent and capability progress annually.
These included:
Over 50 future leaders participated in executive and management development programmes conducted in partnership with leading institutions.
The Hong Kong-based Graduate Trainee programme was reviewed and redesigned into a single programme focused on future leadership and technical capabilities, launching in 2020.
The CLP Power Academy launched its first joint academic and industry-run dual masters’ degree programme in power engineering, in cooperation with the University of Strathclyde (UK) and the Hong Kong University of Science and Technology. This programme’s objective is to help existing and aspiring engineers to deepen their power engineering knowledge and to strengthen the supply of competent engineers for Hong Kong’s power industry. Read more here.
CLP continued to facilitate industrial placement opportunities for engineering students including a new partnership with the University College London, United Kingdom.
Through the structured Performance Management System, 100% of employees set annual individual objectives, reviewed achievements and reviewed performance ratings. These are key inputs in the determination of incentive payments and base pay reviews.
Diversity and inclusion
Standards and procedures
CLP’s human resources policies encourage the retention of female employees through initiatives including flexible work arrangements, maternity leave and other benefits. CLP’s recruitment processes are designed to be fair and non-discriminatory. In Hong Kong, this process follows the Equal Opportunities Commission Code of Practice including the use of consistent selection criteria and in other parts of the Group, CLP complies with local legislation and codes of practice on recruitment. When conducting senior level searches, CLP also requires external recruitment firms to identify diverse candidates, in line with Group Values. In 2018, CLP became a signatory to the International Energy Agency’s "Equal by 30" initiative – a commitment by public and private sector organisations to work towards gender equality in the energy sector by 2030.
Monitoring and follow-up
Gender progress is reviewed as part of regular general management and engineering talent reviews. The Board Human Resources & Remuneration Committee (HR&RC) reviews progress versus gender diversity targets annually.
As at 31 December 2019, 2,068 of CLP's 7,960 employees were female, and the percentages of women in the Group Executive Committee, women in leadership and women in engineering have improved.
Female participation in development programmes continued to improve with female engineers accounting for almost one-third of General Management Development Programme participants, and almost 20% of applications to the new Graduate Trainee programme. CLP continued to support women in engineering with initiatives including the annual Female Engineer Networking event and the mentoring programme for female engineering students. Read more here.
CLP also continued to support The Women’s Foundation in Hong Kong and other initiatives such as the Racial Diversity & Inclusion Charter for Employers developed by the Equal Opportunities Commission (EOC) to promote diversity and inclusion in the workplace.
EnergyAustralia progressed initiatives in indigenous participation, supporting working parents, domestic violence awareness, lesbian, gay, bisexual, transgender and intersex (LGBTI) workplace inclusion and encouraging women to work in the energy generation sector. Flexible working guidelines were introduced to help support carers and work is underway on a comprehensive flexible working strategy.
Find more about other diversity & inclusion initiativesSupporting people to thrive in change
CLP recognises that balancing work and family life can have a significant impact on health and relationships which enhance overall wellbeing and productivity at work. Enhancing employee wellbeing is important to help improve the health status of the workforce, manage the cost of medical benefits, and to reduce the impact of sickness absence on productivity.
CLP aims to provide work environments that are free of harassment or discrimination on the basis of gender, physical or mental state, race, nationality, religion, age, family status or sexual orientation; or any other attribute recognised by the laws of the country in which the company operates.
Standards and procedures
The Code of Conduct underpins the approach to supporting people. Family-friendly leave policies and flexible working arrangements are in place in different parts of the business, and work-life balance programmes and workshops are organised for employees covering areas of physical, social and emotional balance. Confidential employee assistance programmes are also offered to assist employees who may encounter work or personal issues and need professional support.
Monitoring and follow-up
CLP uses independent external consultants to conduct regular employee opinion surveys to understand employees’ views. In Hong Kong, joint consultative committees have been established which act as an additional channel of communication between the company and employees’ selected representatives. Employee benefits are regularly benchmarked to ensure that appropriate support is provided.
Read more on these programmes here.
In Hong Kong, workshops were organised to encourage employees to explore wellbeing, including learning about relationship between nutrition and physical and mental health. Workshops for managers were also developed to guide them in providing support for employees’ emotional wellbeing and fostering a supportive workplace community.
As a caring employer, CLP also understands that employees may face periods of greater demands in their personal lives. To support colleagues, the unpaid leave policy in Hong Kong was enhanced.
Leave entitlements were also reviewed and enhanced in India aiming to create a family-friendly and inclusive workplace for employees. Adoption leave has been introduced for male employees.
Fair work practices
GRI reference: 102-41
CLP's commitment
Human rights
In addition to local legal compliance, CLP respects internationally proclaimed human rights across the value chain. The commitment to upholding human rights is outlined in CLP’s Value Framework, and there is strong recognition that corporate responsibility to respect human rights extends to a network of suppliers and contractors. CLP prohibits the employment of child, forced or compulsory labour in any of its operations. CLP addresses human rights-related issues including health & safety and impacts on local communities when conducting due diligence for target investment or projects.
Fair wages
CLP complies fully with any local legal requirements with respect to minimum wage, and in practice its remuneration and benefits often significantly exceed local legal requirements. It is not Group policy or market practice to provide the same employment benefits to temporary staff as for full-time staff, however the benefits for temporary staff are competitive with local market practice and meet or exceed local legal requirements.
Use of temporary and contractor labour
CLP uses temporary labour for work that is time-bound or peak activity and also engages labour employed by third parties for non-core work and/or work requiring specialist skills. The Group is committed to taking a responsible approach to managing the costs and risks of the contingent workforce including considering whether there is the right strategic balance between the insourcing and outsourcing of capabilities, and whether the working hours and remuneration of workers employed by contractors are fair and reasonable.
Freedom of association
While CLP's management philosophy is that the most appropriate way to engage with colleagues is through direct communication rather than through intermediary organisations, CLP employees have the freedom of association to join organisations and professional bodies of their choice. CLP respects and fully complies with all legal requirements with regards to union membership and collective bargaining.
Standards and procedures
All operations are required to ensure that they do not use child, forced or compulsory labour. Steps taken include stringent checking and control procedures in selection and on-boarding processes, and training for key contractors who provide manpower or services. Following introduction of the Modern Slavery Act 2018 in Australia, the Australian business will commence reporting annually on the risks of modern slavery in its operations and supply chains, and actions to address those risks.
Equal pay for work of equal value is ensured by applying objective and non-discriminatory processes of job evaluation, grading and pay determination. These processes have been confirmed to comply with the Hong Kong Equal Opportunities Commission guidelines on equal pay between men and women under the Sex Discrimination Ordinance. CLP’s Group-wide human resources policy guidelines also requires all subsidiary businesses to have similarly objective and non-discriminatory processes in place.
Monitoring and follow-up
CLP carries out independent audits of its human resources policies and procedures to proactively identify any risks of legal non-compliance and take remedial action if such risks are identified. Immediate action is taken to investigate and address any suspected breaches or issues that are brought to the company’s attention.
Each year, CLP uses independent external consultants to benchmark the remuneration and benefits with relevant recruitment markets. Decisions on remuneration are subject to the corporate governance process and the approval of the Remuneration Committee in order to ensure that a balance between the interests of both employees and shareholders as key stakeholders.
A set of labour standards covering key aspects of the employment relationship in Hong Kong were developed. In the coming year, CLP will continue to undertake reviews and commence engagement with suppliers, with the long-term vision to incorporate these standards progressively into procurement requirements.
The Australian business commenced establishing the cross-functional business capability required to comply with annual Modern Slavery Reporting requirements, in order to prepare for its first report in 2021.
Find out more on CLP's fair work practicesIn 2019, no Group operations were identified in which the right to exercise freedom of association and collective bargaining was violated or at significant risk.
In Australia, CLP engages in collective bargaining with approximately 870 employees via certified enterprise bargaining agreements. These agreements include both notice periods and provisions for consultation and negotiation. EnergyAustralia successfully concluded negotiations for the Retail agreement covering contact centre employees, as well as Hallett and Mt Piper enterprise bargaining agreements which expired in 2019. Negotiations for Yallourn and Newport are in progress. Preparations for negotiation for the Tallawarra agreement and others which will expire in 2020 are underway.
Discrimination and harassment
Standards and procedures
The Group-wide Harassment-free Policy sets a common framework of principles and detailed policies in each country are fully compliant with local legislation. Regular refresher training is organised for employees. All new staff in Hong Kong are required to complete an e-learning programme. Each of the businesses has an employee grievance procedure in place that reflects the Value Framework and any applicable local legal requirements. In the case of any employee having concerns, established procedures are followed to address grievances. All complaints of discrimination and harassment are investigated. These procedures ensure fairness and independence in the investigation process, and respect for the confidentiality of the parties involved.
Monitoring and follow-up
CLP takes all breaches very seriously and disciplinary action can range from a verbal warning to dismissal. Read more in the Code of Conduct and anti-corruption section.
The breaches were managed in accordance with CLP's breaches in Code of Conduct handling process. The relatively higher number of breaches reflects the improved identification and stricter enforcement of workplace behaviour requirements.
CLP India business also produced a web-based orientation session to reinforce India’s local policy on Prevention of Sexual Harassment at the Workplace, which will be released to all employees in early 2020.
Confirmed Code of Conduct breaches in relation to the following three categories are shown below. Refer to the Code of Conduct and anti-corruption section for additional information.
Customer portfolio
CLP Power Hong Kong is the sole electricity provider for Kowloon, the New Territories, and most of the outlying islands, serving 2.6 million customer accounts or about 80% of Hong Kong’s population. Total electricity sales for 2019 were 34,284GWh which all came from sales to Hong Kong customers.
While CLP’s home base Hong Kong is perceived by some as a mature market, there is still a growing demand for electricity. This is largely driven by a number of territory-wide development and infrastructure projects, including the Kai Tak redevelopment, the West Kowloon Cultural District, the Lok Ma Chau Loop, and landmark transport development schemes, such as the Hong Kong-Zhuhai-Macau Bridge, the Hong Kong Boundary Crossing Facilities Island and the Guangzhou-Shenzhen-Hong Kong Express Rail Link. In addition, as Hong Kong becomes a data centre hub, there is a need to ensure highly reliable power supplies to support and facilitate the development of this energy-intensive industry.
EnergyAustralia retails electricity and gas to customers in New South Wales, Victoria, South Australia, the Australian Capital Territory and Queensland (electricity only). It is among the 30 or so retailers active in the key markets of New South Wales and Victoria.
In 2019 the Australian retail market was characterised by intense competition and volatility. High customer churn across all the states in which EnergyAustralia operates reflected the heightened competition for mass-market customers, while increased transfer activity was stimulated by government intervention and media attention. While EnergyAustralia’s churn remained below the market average, lower sales saw customer accounts decreasing to 2.46 million (2018: 2.55 million). However with the mid-year launch of new propositions and tactical plans in place, momentum has increased leading in to the first quarter of 2020.
Smart System Revolutionise Traditional Wet Markets
CLP Power has teamed up with wet market operators to transform traditional markets in Hong Kong, promoting green living with new shopping experiences.
The Company provides consulting services to operators for the integration of innovative smart technologies and energy conservation into their designs.
Red Market (Kwong Yuen Market) is an exemplary market and won the Smart Energy Outstanding Award at the CLP Smart Energy Award 2018 after a marked improvement in energy efficiency. It houses a smart system that comes with cutting-edge technology. Sun sensors automatically adjust the intensity of the indoor LED lighting system, which keeps the market bright while minimising energy consumption. A new smart ventilation system measures real-time carbon dioxide levels inside the market and adjusts its ventilating power accordingly, ensuring the air quality is optimal for shoppers. Solar panels have also been installed on the roof to generate electricity. The Red Market has indeed become a “green market”.
Read more about CLP Smart Energy AwardAccess to electricity
In Hong Kong, CLP offers a Braille bill to assist those who are visually impaired. EnergyAustralia provides interpreter services for those who have a first language other than English, and also offers hearing-impaired and vision-impaired billing services.
Across the Group, special arrangements are in place for customers facing financial difficulties to avoid having to disconnect their electricity supply.
CLP understands that although the tariff level in Hong Kong is reasonable and competitive when compared to other major metropolitan cities around the world, it could potentially act as a financial burden to vulnerable groups.
Hong Kong
In Hong Kong, CLP Power offers concessionary tariffs for the elderly who receive Comprehensive Social Security Assistance. Special arrangements for customers in arrears are also in place, including programmes to help those at risk of supply disconnection. Payment deferral or interest free payments by instalment are offered in demonstrated cases of hardship.
In January 2019, the CLP Power Connect programme was launched where residential customers are encouraged to save energy and where CLP in return offers financial assistance to disadvantaged groups to offset against their electricity expenses. A total of HK$20 million was allocated to subsidise around 40,000 households in 2019, including single elderly or elderly couple, low income families, the disabled and subdivided unit households, with each receiving an electricity subsidy of HK$500. Back in 2015, the programme was the first of its kind in the world to combine energy saving with a mission to help the less fortunate in society, and helped relieve the electricity costs of around 20,000 underprivileged households from 2015 to 2018.
In extreme cases when customers do not pay for their electricity, CLP Power will communicate with the customers and offers assistances including flexible payment options to avoid disconnection.
Australia
EnergyAustralia recognises that all customers need to be able to access its products and services fairly and equally. Through the Energy Charter the Company commits to working together to improve affordability and to support customers experiencing vulnerable circumstances. The EnergyAssist hardship programme helps customers by offering tailored payment plans, payment matching and debt waivers. Customers may also be referred to external community organisations, such as financial counsellors. EnergyAustralia monitors the number of customers in the programme, their debt levels and the number of successful completions. In 2019, a 19% year-on-year increase in graduations was achieved, a significant increase across the two years of the programme.
In order to measure the social impact of the programme, EnergyAustralia began a study in late 2018, and noted improvements for beneficiaries across three areas in 2019, including an increase in control, improved comfort and health, and a reduction in financial stress. The Company also encourages adoption of renewable energy generation through different programmes. In August, EnergyAustralia and the NSW Government Department of Planning, Industry and Environment partnered in a 50% co-funded project that installs up to AUD $1 million of solar PV for eligible EnergyAustralia hardship customers living in NSW public housing.
To help make electricity options simpler, fairer and more affordable, EnergyAustralia also began offering fixed prices on all new in-market plans for the duration of the benefit term, and fairer discounts are now applied off the entire energy bill in Australia.
A changing regulatory landscape in Australia
Australia saw a significant shift in retail electricity regulation in 2019.
The Default Market Offer (DMO) and the Victorian Default Offer (VDO) were both introduced on 1 July 2019, effectively capping retail electricity prices at lower levels. To comply, EnergyAustralia transferred approximately 173,000 customers – around 10% of its electricity retail customer base – to the new tariffs.
EnergyAustralia approached the change as an opportunity to enhance its competitive standing by launching a new suite of products comprising simple, lower-cost services for existing and new customers.
In November 2019, Victoria’s independent regulator responsible for reviewing electricity supply costs announced an increase to the VDO for households and businesses of an average 7.8% in 2020. After reviewing the decision, EnergyAustralia increased tariffs for most customers in the state by a similar amount from 27 January 2020.
Also in November 2019, the Australian Energy Regulator (AER) began proceedings against EnergyAustralia for alleged non-compliance with hardship disconnection rules in relation to eight customers. These proceedings were ongoing at the time this report went to print.
The AER also issued four infringement notices to EnergyAustralia for alleged breaches of the requirements to obtain explicit informed consent in relation to four customers, resulting in penalties totalling A$80,000. Another four infringement notices were issued for failures to promptly appoint a metering coordinator in response to metering installation malfunctions, leading to penalties totalling A$80,000.
EnergyAustralia meanwhile reported a number of incidents to the AER regarding registering life support needs for some of its customers.
The company remains focused on improving its compliance across each of these areas and is fully co-operating with the regulators.
Lighting up lives in remote Hakka villages
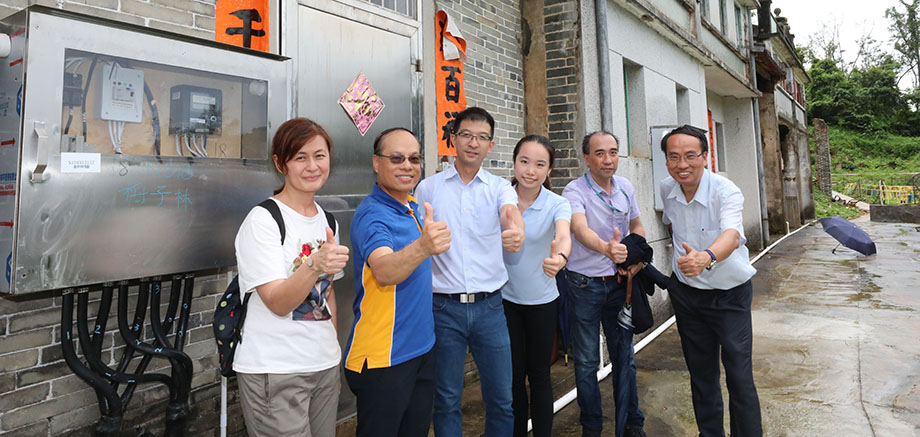
CLP continues to bring electricity to remove villages, supporting rural revitalisation and eco-tourism by connecting Mui Tsz Lam and Kap Tong to the grid.
A desire to look after people left behind by the march of modernity has characterised the work of the Kadoorie family since the 19th century – and it is a mission which CLP is carrying forward into a new era of technology and super-connectivity in the 21st century.
To support rural revitalisation and eco-tourism development in the Lai Chi Wo area of the northeastern New Territories, CLP Power completed a power supply for the remote Hakka villages of Mui Tsz Lam and Kap Tong in May 2019.
Mui Tsz Lam and Kap Tong are walled villages with long and rich histories, but electricity has been disconnected for over 40 years. Thanks to the installation of pole-mounted transformers and the laying of approximately five kilometres of underground cables, the two villages now enjoy a dependable electricity supply that presents new opportunities to promote ecotourism and preserve the area’s Hakka culture. CLP Power has also installed smart meters in homes so engineers can better monitor the new power supply and villagers can understand their consumption patterns and manage their electricity use to save energy.
Customer satisfaction
Strategies and procedures
CLP customers can access information on products and services in a timely and efficient manner through a number of communication channels, such as a welcome pack for all new customers, information on the CLP Hong Kong websites and CLP Mobile App, and the EnergyAustralia websites and Mobile Apps.
In addition to providing information, CLP strives to effectively respond to customer needs and preferences. The Customer Interaction Centre (CIC) in Hong Kong has an internal service pledge to follow up verbal complaints within 24 hours and to acknowledge written complaints within two working days. All escalated cases are studied thoroughly in order to appropriately resolve the issues customers have raised.
At EnergyAustralia, there are over two million conversations with customers every year, either over the phone or via digital service channels. The Company also engages more than 20,000 customers and stakeholders annually through formal research to help shape business decisions, products and services.
Monitoring and follow-up
To gauge customer feedback about retail services and performance, customer satisfaction surveys are conducted regularly.
In Hong Kong, an external market research consultant conducts an annual telephone survey. The customer satisfaction score considers overall satisfaction towards CLP and a relative rating against an ideal utility in Hong Kong. The score is benchmarked against the public utilities in the energy sector and other public service organisations. The survey also gauges the number of customer enquiries and complaints received by the Customer Interaction Centre (CIC) and Customer Service Centres (CSC).
EnergyAustralia has been measuring its Strategic Net Promoter Score (NPS) to assess customer engagement since 2012. This is measured monthly via an online survey, which is sent to a representative group of customers. The Transactional Net Promoter Score is also used to track customer satisfaction in relation to specific customer interactions, providing more direct feedback for frontline staff. EnergyAustralia also measures the number of calls and complaints received.
In Hong Kong, CLP received thousands of customer enquiries and no justified cases of complaints in 2019.
EnergyAustralia has applied a sustained focus on improving customer outcomes over several years. Investing in improved digital channels, billing processes, problem resolution, new customer-centric propositions brought to market and a sustained period of pricing stability has ensured that customers are receiving better value from EnergyAustralia.
The 2019 results are reflective of the combination of these customer experience improvements. Customer calls have reduced by 22.4% and total complaints decreased by 12%. Significantly, implementation of a more customer-centric dispute resolution process improved internal resolution of complaints without further escalation to the ombudsman. Overall, ombudsman complaints were reduced by 29%.
The culmination of improved customer outcomes was a significant improvement in the Strategic NPS through 2019, an increase of 8.8 points from 2018.
An industry united to put customers first
EnergyAustralia Managing Director Catherine Tanna (third from right, front row) joins Australian energy company CEOs to sign the Energy Charter. (Photo by Jess Gleeson)
EnergyAustralia is proud to be a founding member of The Energy Charter, a worldwide energy industry first, bringing companies from across the supply chain together to deliver a better experience for customers and improve affordability during the transition to a clean energy future.
The Company was one of 18 signatories which undertook to embed the Charter principles across the business and evaluate where it was performing well, and where improvements needed to be made.
Programmes addressing issues of employee and customer safety have been put in place to address the identified gaps. EnergyAustralia continues to embed the feedback from conversations with customers in the way products and services are designed. It also continues to collaborate on initiatives that focus on service and affordability improvements for customers, as well as continuing to work together as an industry to meet customer expectations on the energy transition.
The Independent Accountability Panel reviewed all signatories’ disclosures and met with each company’s CEO. Following a period of public consultation, the Panel issued a report with 32 recommendations across six themes. When preparing for its second disclosure, EnergyAustralia will continue to embed the Charter principles within the business as well as reflecting on the feedback received in year one.
Read EnergyAustralia’s Energy Charter Disclosure (30 June 2019)Customer privacy
In Hong Kong the Personal Data (Privacy) Ordinance (PDPO) governs the protection of personal data of individuals. The Data Protection Principles in the PDPO frame CLP Power’s obligations (as a data user) relating to the collection, accuracy, retention, use and security of personal data, and a customer’s right to access their personal data.
EnergyAustralia has obligations under the Australian Privacy Act 1988 to ensure that personal information is appropriately used, handled and managed. Further to this, in February 2018, the mandatory data breach reporting obligations under Part IIIC of the Privacy Act 1988 came into effect. This new scheme requires data breaches that are likely to result in serious harm to individuals to be assessed within a specific timeframe and, if notifiable, reported to the Office of the Australian Information Commissioner (OAIC) and to the affected customers.
Strategy and procedures
All employees must follow CLP procedures/ practices and local regulations in relation to personal data privacy. The CLP Group preserves the confidentiality of the personal data provided to it in accordance with the CLP Privacy Policy Statement, which was updated with effect from 1 November 2018. The CLP Personal Data Protection Compliance Manual (2018 version) was brought into effect on 31 October 2018 to provide guidance to business units with operations in Hong Kong.
Monitoring and follow-up
CLP monitors and documents any complaints related to breaches of customer privacy and the loss of customer data. In addition to the CLP Personal Data Protection Compliance Manual, the Customer & Business Development Unit has a written guideline for handling customer data incidents. The guideline includes the classification and assessment of the scope and severity of a data incident, reporting roles and responsibilities, and the incident response strategy and checklist. The Corporate Data Protection Officer also retains a record of data incidents and follow-up actions. CLP’s Hong Kong retail business has reported or noted no customer data loss cases in 2019.
EnergyAustralia has also developed a Data Breach Response Plan and established a Data Breach Response Team. The plan outlines the strategy for assessing, managing, containing and reporting data breaches within required timeframes and includes the articulation of roles and responsibilities. It is enacted each time a potential data breach is identified.
Training and awareness
Customer privacy may be compromised as a result of a cyber security incident, or by the mishandling of customer information by employees. In 2019, training was provided on data protection through Internal Control Awareness Communications, at Legal Review Committee meetings, as well as with all data protection officers and record managers. Within individual business units, CLP runs awareness programmes through newsletters, briefings and refreshers on data protection principles. Industry threats are continuously reviewed with a view to strengthening controls on managing and monitoring networks, systems and mobile devices, data loss and suspicious cyber activities. CLP also regularly reinforces the need for timely reporting of potential privacy incidents and the reporting mechanisms available.
At EnergyAustralia, customer privacy was the focus of briefing sessions with leadership, enterprise-wide communications and employee training to ensure all staff are up-to-date with current privacy and data management.
Read more on how CLP protects personal data
Demand-side management
As part of the continuous efforts to drive towards a greener future, CLP is stepping up its DSM measures. Energy management offers mutual benefits to customers and to the business. For customers, the bills can be reduced, and for power companies, new investment in electricity infrastructure can be deferred.
The CLP Power Customer Service Quality Policy also includes a commitment to support customers to use CLP products and services more efficiently and effectively.
Goals and targets
In Hong Kong, CLP’s operation is regulated by the Scheme of Control Agreement (SCA), in which the current SCA (2018-2033) has a list of refinements on energy saving and demand side management goals and targets to the previous SCA (2008-2018). It includes:
Performance targets for Energy Audit and energy saved from the energy audits under the current SCA are set at about four times the previous targets, which will offer 600 energy audits to business customers a year with total electricity saved expecting to reach 48GWh each year.
Demand response programmes are offered to commercial and industrial customers in order to lower the overall system demand, resulting in a lower requirement for investments in new generation units in the long-term. The target for this initiative is to achieve a reduction of up to 60MW from the demand peak.
A new five-year energy saving target has been set. CLP must achieve at least 4% of energy savings on the basis of the average annual sales within a five-year period in order to earn incentives. More incentives will be given if the energy saving reaches 5%.
Strategy and procedures
Drawing on CLP’s long expertise in the power industry, residential and business customers and the community at large are encouraged to use energy more efficiently and to change their behaviour so that they can save more energy and help to create a better environment.
CLP aims to change people’s habit for energy conservation via:
Educating the public;
Providing customers with information and energy-saving tips;
Equipping customers with tools and technical support; and
Supporting enablers to make greater energy efficiency possible.
In Hong Kong, various initiatives were implemented in 2019. More information can be accessed here.
Providing free professional consultancy services and subsidies to help customers enhance energy efficiency:
Encouraging and supporting local renewable energy generation:
Providing tools to customers for better energy usage management:
Encouraging residential customers to save energy for benefiting disadvantaged groups:
Learn more about successful cases of Eco-Building Fund
Watch video
In Australia, EnergyAustralia implemented various initiatives in 2019 to serve the following purposes. More information can be accessed here.
Encouraging and supporting local renewable energy generation
Providing tools to customers for better energy usage management
Supply chain management
Operational responsibilities
Procurement and supply chain management are an integral part of business operations across the CLP Group. CLP procurement professionals aim to develop and implement effective supply market strategies to acquire quality products and services, reduce supply chain risks, realise Group-wide synergies and deliver optimised supply chain value to stakeholders.
Strategies and procedures
To ensure alignment with business commitments, the CLP Group Procurement Strategy supports these objectives through key delivery pillars:
development of the Group Procurement Standard (GPS)
Group-level Category Planning, Sourcing and Supplier Management
cross-regional delivery support on key projects, supplier engagements and improvement initiatives
federated functional leadership, governance and oversight.
The CLP Group Procurement Standard (GPS) aims to drive the consistent adoption of leading practices and capabilities across the Group. It is comprised of sixteen “Process” and “Enabler” elements as illustrated in the figure below, including Responsible Procurement, Supplier Risk Management and Supplier Relationship Management.
The CLP Group Procurement Standard
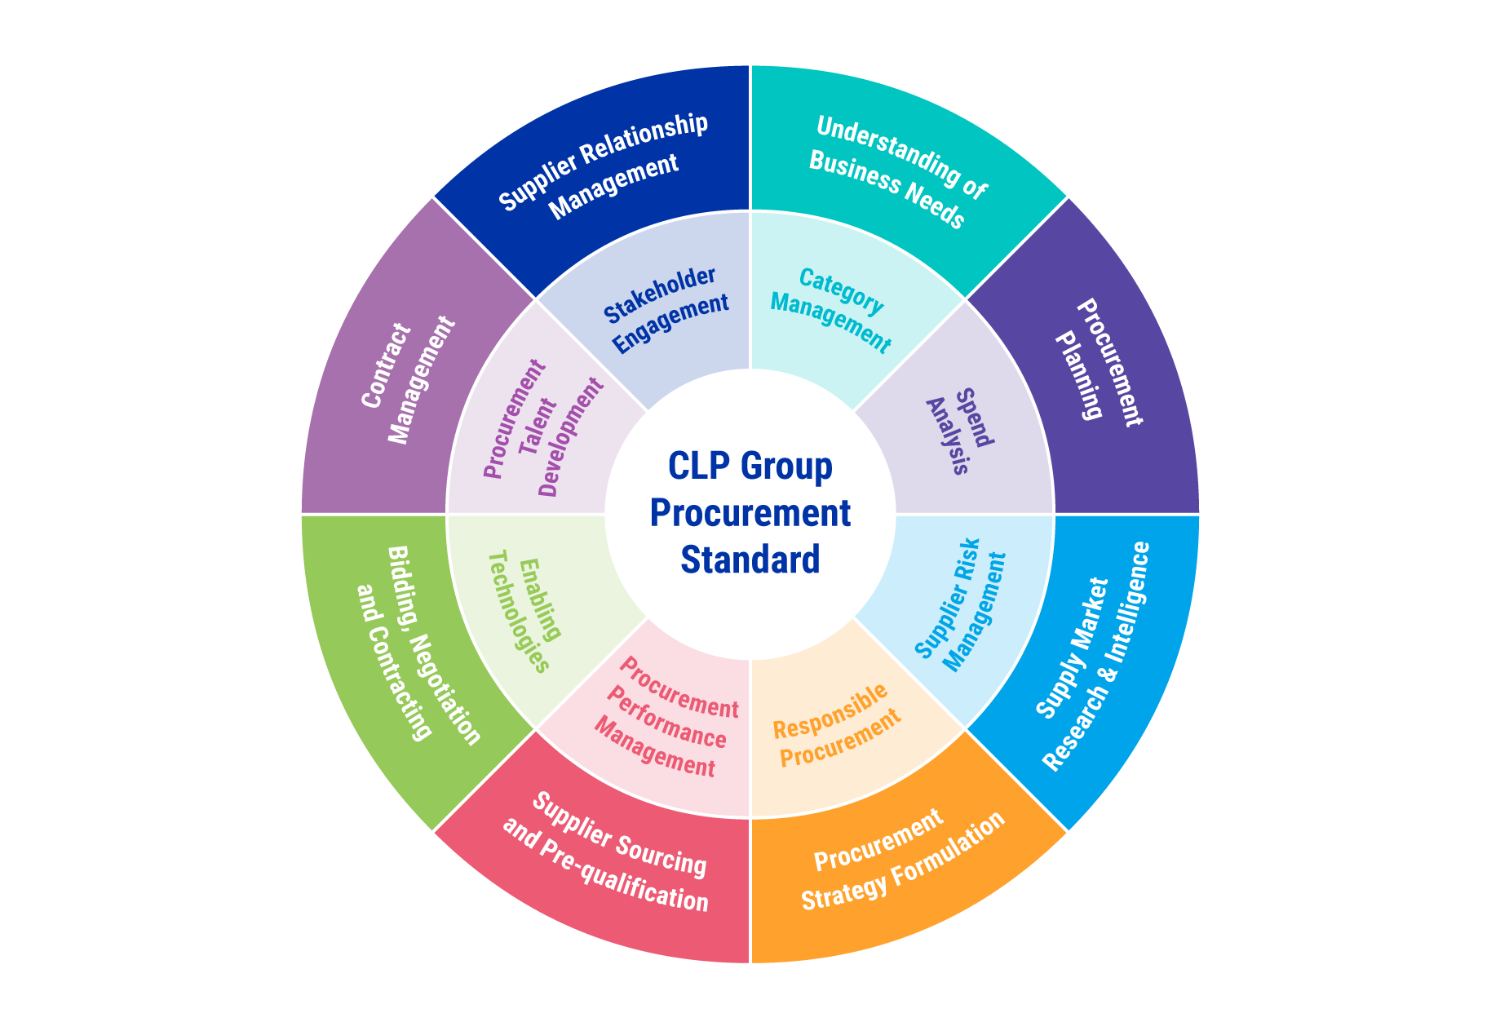
Group Procurement Standard (GPS)
All procurement commitments comply with CLP policies, which include :
(i) CLP’s Value Framework;
(ii) CLP Procurement Values and Principles which highlight the Procurement Missions, Governance, Commitment and Strategies;
(iii) CLP Group Responsible Procurement Policy Statement (RePPS) which highlights the Company's requirements and expectations on suppliers; and
(iv) other procurement policies that governs daily CLP operations.
These day-to-day operations are also guided by CLP’s Whistleblowing Policy and Harassment-Free Workplace Policy. As a trusted partner, CLP encourages suppliers to uphold the applicable principles outlined in these two policies.
Procurement is actively involved in supporting category and project steering committees, and ensuring appropriate oversight and governance is applied for procurement decision-making. In addition, procurement commitments are made with reference to clearly defined regional Company Management Authority Manuals (CMAM).
Monitoring and follow-up
Group Category Councils have been established to oversee aggregated future procurement needs, supply market opportunities and risks and the development of procurement strategies. Procurement and business units work in close partnership to formulate sourcing strategies, providing enhanced insights into the supply market. This collaboration has increased CLP’s ability in negotiation and managing risk and supplier relationships, resulting in tangible commercial benefits for the businesses.
By following the Group Procurement Standard, businesses across the Group are implementing industry-leading practices in sourcing and supplier management, committing to responsible procurement to build a more sustainable supply chain.
CLP designs fit-for-purpose sourcing strategies to select suppliers who will best meet its requirements and deliver the most value. Supplier selections are typically conducted through competitive tendering and based on an assessment of the supplier’s ability to meet quality, health and safety, environment, delivery, innovation, sustainability and cost requirements. CLP ensures its contracts safeguard stakeholder interests, and reflect suppliers’ commitments and obligations, including legal and regulatory compliance, safeguarding intellectual property rights, data confidentiality and security.
CLP segments contracted suppliers into tiers which help determine the appropriate level of governance and engagement. Segmentation is reviewed annually based on relative contract value and potential business impact, including risks in relation to supply chain and sustainability.
In line with the Corporate Risk Framework, CLP periodically assesses its exposure to strategic supplier risks through heatmaps that reveal the likelihood of failure events and their potential impact on the business. CLP then develops and implements mitigation plans with the suppliers to actively mitigate these risks.
Continuous improvement
CLP has enhanced its Supplier Relationship Management process for strategic suppliers to consistently measure delivery performance, drive continuous improvements and ensure alignment through year-round operational, business and executive reviews.
CLP reviews past performance, future business needs, as well as technology and innovation roadmaps regularly with suppliers. While suppliers’ performance is measured under a structured framework, they are also invited to provide feedback to CLP to enhance candid two-way communication and continuous improvements in the long run. Specific focus on technology roadmaps and innovation will also empower CLP for future challenges.
Responsible procurement
These expectations are based on four pillars:
Legal Compliance;
Respect for People – includes safe working environment, good employment practices, no discrimination and no use of child labour or forced labour;
Ethics and Business Conduct – includes transparency in business process, a high standard of business conduct and no conflict of interest; and
Environmental Stewardship – including the efficient use of resources, responsible disposal of waste, and the monitoring of environmental performance to improve over time.
CLP believes its commitment to continuous improvement, and its ongoing efforts in encouraging others to adopt best practice can create benefits throughout the supply chain, as well as building good corporate citizenship.
Download the Responsible Procurement Policy StatementOperational responsibilities
CLP contract terms and conditions outline specific project sustainability requirements and expectations in terms of business ethics. The Company also encourages suppliers to abide by the principles stated in the RePPS and expects them to adopt similar standards and practices when doing business with the CLP Group
The CLP team leading Responsible Procurement engages with key internal and external stakeholders to promote procurement practices aimed at reducing Environmental, Social and Governance (ESG) risks and enhancing supplier capabilities to meet CLP’s sustainability requirements.
Strategies and procedures
CLP takes a risk-based approach in implementing responsible procurement across the procurement lifecycle. Sustainability risks are identified and evaluated regularly at category, project and supplier levels against each of the four responsible procurement pillars. This evaluation considers:
Country-specific risks
Product/service-specific risks
Industry/category-specific risks
Legal and regulatory compliance risks
Labour practices and sub-contracting risks
Health and safety risks
Governance and business conduct risks
Environmental risk
Brand and reputational risks.
Specifically, the risk assessment aims to help CLP manage ESG issues, such as labour practices, human rights, modern slavery, child labour, harassment, safety, environment, subcontractor management and anti-bribery along the value chain. The risk assessment result provides insights into sourcing strategies development for categories and risk mitigation for strategic suppliers.
CLP defines critical projects considering their importance to business operations, ESG risk, and contract value. For these critical projects, suppliers are assessed on their sustainability practices through various tools including self-declared questionnaires, proposal evaluation, site visits, and where subcontracting is involved, audits on subcontractors’ capability to meet projects’ requirements.
Quarterly risk assessments are conducted for strategic suppliers, in conjunction with supplier risk management and supplier relationship management processes. Risk mitigation plans are developed to address identified risks related to delivery performance, supply disruptions and business continuity, and sustainability within the supply chain. Regular meetings with suppliers are conducted to discuss progress of mitigation plans and explore opportunities for further improvement
Continuous improvement
Following the publishing of the ISO Guide on Sustainable Procurement (ISO 20400:2017), a review and benchmarking exercise of CLP’s responsible procurement practices against those of other industry leaders were conducted in 2018. CLP Power Hong Kong takes a pilot role in reviewing the Responsible Procurement Policy Statement and developing future roadmap in 2019. The aim is to introduce more definite sustainability requirements on suppliers to further uplift suppliers’ sustainability capability and enhance the following in the future:
Strategic approach to manage sustainability risk
Suppliers’ sustainability risk management in supplier selection and supplier relationship management implementation
Analysis of sustainability risk for suppliers’ location and purchasing categories
Suppliers’ sustainability performance improvement through key performance indicators, periodical site visit or third-party assessment to assess the sustainability risk.
CLP regularly conducts workshops for contractors to uplift their safety and environmental awareness and capability. To enhance professional development of staff, workshops and training on procurement practices and supplier relationship management are conducted.
In 2019, the Group sourced from 6,362 suppliers representing a total of HK$36.73 billion– 87% of these spend are from local suppliers based in the respective Hong Kong, Mainland China, India and Australia markets. CLP will strengthen analysis of sustainability risk for suppliers’ location to better manage supply chain sustainability risk even though a significant share of third-party spend has been with local suppliers. To promote CLP’s core value of “Cares for the Community”, a number of local non-governmental organisations (NGO) were engaged for purchases.
In 2019, CLP has assessed 45 strategic suppliers, which constitute 52% of the year’s spend, against sustainability requirements. The CLP team also conducted follow-up site visits with five suppliers with the aim of identifying opportunities to collaborate for improving sustainability performance. All the strategic suppliers have processes and risk mitigation plans in place to manage risk for uplifting their capability continually. Service providers in Hong Kong on temporary manpower service are assessed on the accuracy and timeliness of temporary manpower’s pay and working hours against CLP’s requirement.
No significant risk findings related to the Responsible Procurement Policy Statement was identified in 2019 amongst these strategic suppliers
As part of the development for the future responsible procurement roadmap, CLP Power has revamped its purchasing categories sustainability risk assessment to strengthen the analysis on raw and residual risk, and labour practice risks. Pilot risk assessment covered key categories, at around 80% of 2019 spend.
2019 data shaded in orange have been independently verified by PricewaterhouseCoopers. The assurance scope of past years' data can be found in previous Sustainability Reports.
Code of Conduct and anti-corruption
2019 data shaded in orange have been independently verified by PricewaterhouseCoopers. The assurance scope of past years' data can be found in previous Sustainability Reports.
Occupational health and safety
2019 data shaded in orange have been independently verified by PricewaterhouseCoopers. The assurance scope of past years' data can be found in previous Sustainability Reports.
Environmental regulations and compliance
Air emissions
Waste
Water
2019 data shaded in orange have been independently verified by PricewaterhouseCoopers. The assurance scope of past years' data can be found in previous Sustainability Reports.
Greenhouse gas emissions
Climate-related financial information
2019 data shaded in orange have been independently verified by PricewaterhouseCoopers. The assurance scope of past years' data can be found in previous Sustainability Reports.
Asset management
Availability and reliability
2019 data shaded in orange have been independently verified by PricewaterhouseCoopers. The assurance scope of past years' data can be found in previous Sustainability Reports.
Community investment
2019 data shaded in orange have been independently verified by PricewaterhouseCoopers. The assurance scope of past years' data can be found in previous Sustainability Reports.
Employment practice
Talent and skills for the future
Diversity and inclusion
Discrimination and harassment
2019 data shaded in orange have been independently verified by PricewaterhouseCoopers. The assurance scope of past years' data can be found in previous Sustainability Reports.
Customer portfolio
Access to electricity
Customer satisfaction
2019 data shaded in orange have been independently verified by PricewaterhouseCoopers. The assurance scope of past years' data can be found in previous Sustainability Reports.
Responsible procurement
2019 data shaded in orange have been independently verified by PricewaterhouseCoopers. The assurance scope of past years' data can be found in previous Sustainability Reports.


